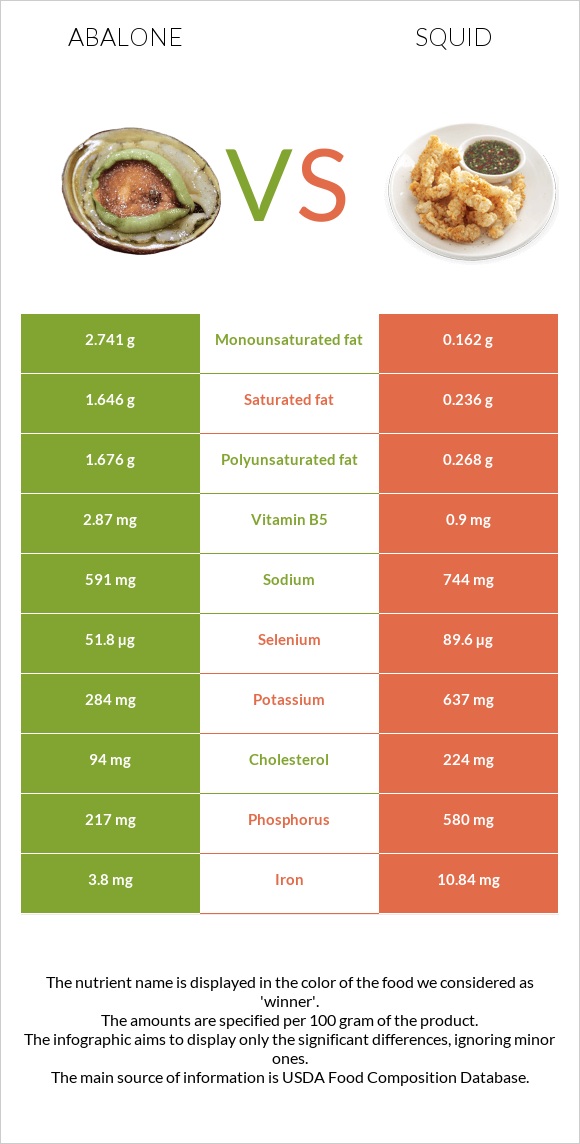
A recap on the differences between abalone and squid Abalone is higher in vitamin B5 and vitamin B1, yet squid is higher in vitamin B12, vitamin B2, iron, copper, selenium, phosphorus, and zinc. Squid covers your daily vitamin B12 needs 196% more than abalone. Abalone contains 13 times more vitamin B1 than squid. While abalone contains 0.22mg of vitamin B1, squid contains only 0.017mg. The amount of cholesterol in abalone is lower. Food varieties used in this article are Mollusks, abalone, mixed species, cooked, fried and Mollusks, cuttlefish, mixed species, cooked, moist heat .
Infographic
Mineral Comparison
Mineral comparison score is based on the number of minerals by which one or the other food is richer. The "coverage" charts below show how much of the daily needs can be covered by 300 grams of the food.
1
100 g
300 g
3 oz - 85g
Magnesium
Magnesium
Calcium
Calcium
Potassium
Potassium
Iron
Iron
Copper
Copper
Zinc
Zinc
Phosphorus
Phosphorus
Sodium
Sodium
Manganese
Manganese
Selenium
Selenium
40%
11%
25%
143%
76%
26%
93%
77%
9.1%
283%
8
100 g
300 g
3 oz - 85g
Magnesium
Magnesium
Calcium
Calcium
Potassium
Potassium
Iron
Iron
Copper
Copper
Zinc
Zinc
Phosphorus
Phosphorus
Sodium
Sodium
Manganese
Manganese
Selenium
Selenium
43%
54%
56%
407%
333%
94%
249%
97%
27%
489%
Vitamin Comparison
Vitamin comparison score is based on the number of vitamins by which one or the other food is richer. The "coverage" charts below show how much of the daily needs can be covered by 300 grams of the food.
2
100 g
300 g
3 oz - 85g
Vitamin C
Vit. C
Vitamin D
Vit. D
Vitamin A
Vit. A
Vitamin E
Vit. E
Vitamin B1
Vit. B1
Vitamin B2
Vit. B2
Vitamin B3
Vit. B3
Vitamin B5
Vit. B5
Vitamin B6
Vit. B6
Vitamin B12
Vit. B12
Vitamin K
Vit. K
Folate
Folate
6%
0%
0.67%
0%
55%
30%
36%
172%
35%
86%
0%
11%
7
100 g
300 g
3 oz - 85g
Vitamin C
Vit. C
Vitamin D
Vit. D
Vitamin A
Vit. A
Vitamin E
Vit. E
Vitamin B1
Vit. B1
Vitamin B2
Vit. B2
Vitamin B3
Vit. B3
Vitamin B5
Vit. B5
Vitamin B6
Vit. B6
Vitamin B12
Vit. B12
Vitamin K
Vit. K
Folate
Folate
28%
0%
68%
0%
4.3%
399%
41%
54%
62%
675%
0%
18%
All nutrients comparison - raw data values
Nutrient
DV% diff.
Vitamin B12
0.69µg
5.4µg
196%
Vitamin B2
0.13mg
1.729mg
123%
Iron
3.8mg
10.84mg
88%
Copper
0.228mg
0.998mg
86%
Selenium
51.8µg
89.6µg
69%
Phosphorus
217mg
580mg
52%
Cholesterol
94mg
224mg
43%
Vitamin B5
2.87mg
0.9mg
39%
Protein
19.63g
32.48g
26%
Zinc
0.95mg
3.46mg
23%
Vitamin A
2µg
203µg
22%
Vitamin B1
0.22mg
0.017mg
17%
Calcium
37mg
180mg
14%
Potassium
284mg
637mg
10%
Vitamin B6
0.15mg
0.27mg
9%
Polyunsaturated fat
1.676g
0.268g
9%
Fats
6.78g
1.4g
8%
Vitamin C
1.8mg
8.5mg
7%
Sodium
591mg
744mg
7%
Manganese
0.07mg
0.209mg
6%
Saturated fat
1.646g
0.236g
6%
Monounsaturated fat
2.741g
0.162g
6%
Carbs
11.05g
1.64g
3%
Folate
14µg
24µg
3%
Calories
189kcal
158kcal
2%
Vitamin B3
1.9mg
2.189mg
2%
Magnesium
56mg
60mg
1%
Protein per 100 calories
10g
21g
N/A
Calories per 10 g protein
96kcal
49kcal
N/A
Weight per 100 calories
53g
63g
N/A
Unsaturated / Saturated Fat ratio
2.7
1.8
N/A
Net carbs
11.05g
1.64g
N/A
Tryptophan
0.224mg
0.364mg
0%
Threonine
0.838mg
1.398mg
0%
Isoleucine
0.854mg
1.414mg
0%
Leucine
1.386mg
2.287mg
0%
Lysine
1.433mg
2.427mg
0%
Methionine
0.441mg
0.733mg
0%
Phenylalanine
0.715mg
1.164mg
0%
Valine
0.86mg
1.419mg
0%
Histidine
0.378mg
0.624mg
0%
Omega-3 - EPA
0.054g
0.078g
N/A
Omega-3 - DHA
0.132g
N/A
Omega-3 - DPA
0.046g
0.012g
N/A
Macronutrient Comparison
Macronutrient breakdown side-by-side comparison
2
20%
7%
11%
60%
2%
Protein:
19.63 g
Fats:
6.78 g
Carbs:
11.05 g
Water:
60.1 g
Other:
2.44 g
3
32%
61%
3%
Protein:
32.48 g
Fats:
1.4 g
Carbs:
1.64 g
Water:
61.12 g
Other:
3.36 g
Contains
more
Fats Fats
+384.3%
Contains
more
Carbs Carbs
+573.8%
Contains
more
Protein Protein
+65.5%
Contains
more
Other Other
+37.7%
Fat Type Comparison
Fat type breakdown side-by-side comparison
2
27%
45%
28%
Saturated fat:
Sat. Fat
1.646 g
Monounsaturated fat:
Mono. Fat
2.741 g
Polyunsaturated fat:
Poly. Fat
1.676 g
1
35%
24%
40%
Saturated fat:
Sat. Fat
0.236 g
Monounsaturated fat:
Mono. Fat
0.162 g
Polyunsaturated fat:
Poly. Fat
0.268 g
Contains
more
Mono. Fat Monounsaturated fat
+1592%
Contains
more
Poly. Fat Polyunsaturated fat
+525.4%
Contains
less
Sat. Fat Saturated fat
-85.7%