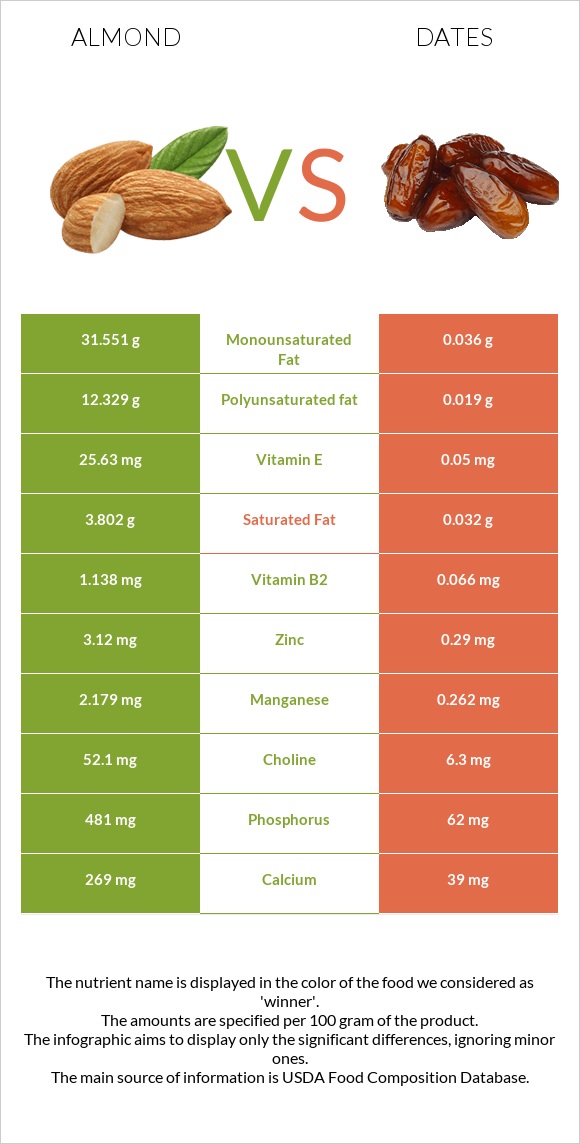
How are almonds and dates different? Almonds are higher than dates in vitamin E, copper, manganese, vitamin B2, phosphorus, magnesium, iron, zinc, and calcium. Almonds cover your daily need for vitamin E, 171% more than dates. Almonds contain 119 times more saturated fat than dates. Almonds contain 3.802g of saturated fat, while dates contain 0.032g. Dates have a higher glycemic index (42) than almonds (0). Nuts, almonds and Dates, deglet noor types were used in this article.
Infographic
Mineral Comparison
Mineral comparison score is based on the number of minerals by which one or the other food is richer. The "coverage" charts below show how much of the daily needs can be covered by 300 grams of the food.
10
100 g
300 g
1 almond - 1.2g 1 oz (23 whole kernels) - 28.35g 1 cup, sliced - 92g 1 cup, ground - 95g 1 cup, slivered - 108g 1 cup, whole - 143g
Magnesium
Magnesium
Calcium
Calcium
Potassium
Potassium
Iron
Iron
Copper
Copper
Zinc
Zinc
Phosphorus
Phosphorus
Sodium
Sodium
Manganese
Manganese
Selenium
Selenium
193%
81%
65%
139%
344%
85%
206%
0.13%
284%
22%
0
100 g
300 g
1 date, pitted - 7.1g 1 cup, chopped - 147g
Magnesium
Magnesium
Calcium
Calcium
Potassium
Potassium
Iron
Iron
Copper
Copper
Zinc
Zinc
Phosphorus
Phosphorus
Sodium
Sodium
Manganese
Manganese
Selenium
Selenium
31%
12%
58%
38%
69%
7.9%
27%
0.26%
34%
16%
Vitamin Comparison
Vitamin comparison score is based on the number of vitamins by which one or the other food is richer. The "coverage" charts below show how much of the daily needs can be covered by 300 grams of the food.
5
100 g
300 g
1 almond - 1.2g 1 oz (23 whole kernels) - 28.35g 1 cup, sliced - 92g 1 cup, ground - 95g 1 cup, slivered - 108g 1 cup, whole - 143g
Vitamin C
Vit. C
Vitamin D
Vit. D
Vitamin A
Vit. A
Vitamin E
Vit. E
Vitamin B1
Vit. B1
Vitamin B2
Vit. B2
Vitamin B3
Vit. B3
Vitamin B5
Vit. B5
Vitamin B6
Vit. B6
Vitamin B12
Vit. B12
Vitamin K
Vit. K
Folate
Folate
0%
0%
0%
513%
51%
263%
68%
28%
32%
0%
0%
33%
4
100 g
300 g
1 date, pitted - 7.1g 1 cup, chopped - 147g
Vitamin C
Vit. C
Vitamin D
Vit. D
Vitamin A
Vit. A
Vitamin E
Vit. E
Vitamin B1
Vit. B1
Vitamin B2
Vit. B2
Vitamin B3
Vit. B3
Vitamin B5
Vit. B5
Vitamin B6
Vit. B6
Vitamin B12
Vit. B12
Vitamin K
Vit. K
Folate
Folate
1.3%
0%
0%
1%
13%
15%
24%
35%
38%
0%
6.8%
14%
All nutrients comparison - raw data values
Nutrient
DV% diff.
Vitamin E
25.63mg
0.05mg
171%
Copper
1.031mg
0.206mg
92%
Manganese
2.179mg
0.262mg
83%
Vitamin B2
1.138mg
0.066mg
82%
Polyunsaturated fat
12.329g
0.019g
82%
Monounsaturated fat
31.551g
0.036g
79%
Fats
49.93g
0.39g
76%
Phosphorus
481mg
62mg
60%
Magnesium
270mg
43mg
54%
Protein
21.15g
2.45g
37%
Iron
3.71mg
1.02mg
34%
Zinc
3.12mg
0.29mg
26%
Fructose
0.11g
19.56g
24%
Calcium
269mg
39mg
23%
Carbs
21.55g
75.03g
18%
Fiber
12.5g
8g
18%
Saturated fat
3.802g
0.032g
17%
Calories
579kcal
282kcal
15%
Vitamin B3
3.618mg
1.274mg
15%
Vitamin B1
0.205mg
0.052mg
13%
Choline
52.1mg
6.3mg
8%
Folate
44µg
19µg
6%
Potassium
733mg
656mg
2%
Selenium
4.1µg
3µg
2%
Vitamin B5
0.471mg
0.589mg
2%
Vitamin B6
0.137mg
0.165mg
2%
Vitamin K
0µg
2.7µg
2%
Protein per 100 calories
3.7g
0.87g
N/A
Calories per 10 g protein
274kcal
1151kcal
N/A
Weight per 100 calories
17g
35g
N/A
Unsaturated / Saturated Fat ratio
12
1.7
N/A
Vitamin C
0mg
0.4mg
0%
Net carbs
9.05g
67.03g
N/A
Sugar
4.35g
63.35g
N/A
Starch
0.72g
0%
Sodium
1mg
2mg
0%
Trans fat
0.015g
0g
N/A
Tryptophan
0.211mg
0.012mg
0%
Threonine
0.601mg
0.043mg
0%
Isoleucine
0.751mg
0.049mg
0%
Leucine
1.473mg
0.084mg
0%
Lysine
0.568mg
0.066mg
0%
Methionine
0.157mg
0.022mg
0%
Phenylalanine
1.132mg
0.05mg
0%
Valine
0.855mg
0.071mg
0%
Histidine
0.539mg
0.032mg
0%
Omega-3 - ALA
0.003g
N/A
Omega-6 - Eicosadienoic acid
0.002g
0g
N/A
Omega-6 - Linoleic acid
12.32g
N/A
Macronutrient Comparison
Macronutrient breakdown side-by-side comparison
3
21%
50%
22%
4%
3%
Protein:
21.15 g
Fats:
49.93 g
Carbs:
21.55 g
Water:
4.41 g
Other:
2.96 g
2
2%
75%
21%
Protein:
2.45 g
Fats:
0.39 g
Carbs:
75.03 g
Water:
20.53 g
Other:
1.6 g
Contains
more
Protein Protein
+763.3%
Contains
more
Fats Fats
+12702.6%
Contains
more
Other Other
+85%
Contains
more
Carbs Carbs
+248.2%
Contains
more
Water Water
+365.5%
Fat Type Comparison
Fat type breakdown side-by-side comparison
2
8%
66%
26%
Saturated fat:
Sat. Fat
3.802 g
Monounsaturated fat:
Mono. Fat
31.551 g
Polyunsaturated fat:
Poly. Fat
12.329 g
1
37%
41%
22%
Saturated fat:
Sat. Fat
0.032 g
Monounsaturated fat:
Mono. Fat
0.036 g
Polyunsaturated fat:
Poly. Fat
0.019 g
Contains
more
Mono. Fat Monounsaturated fat
+87541.7%
Contains
more
Poly. Fat Polyunsaturated fat
+64789.5%
Contains
less
Sat. Fat Saturated fat
-99.2%
Carbohydrate type comparison
Carbohydrate type breakdown side-by-side comparison
2
14%
78%
3%
2%
Starch:
0.72 g
Sucrose:
3.95 g
Glucose:
0.17 g
Fructose:
0.11 g
Lactose:
0 g
Maltose:
0.04 g
Galactose:
0.07 g
4
38%
31%
31%
Starch:
0 g
Sucrose:
23.84 g
Glucose:
19.87 g
Fructose:
19.56 g
Lactose:
0 g
Maltose:
0.12 g
Galactose:
0 g
Contains
more
Starch Starch
+∞%
Contains
more
Galactose Galactose
+∞%
Contains
more
Sucrose Sucrose
+503.5%
Contains
more
Glucose Glucose
+11588.2%
Contains
more
Fructose Fructose
+17681.8%
Contains
more
Maltose Maltose
+200%