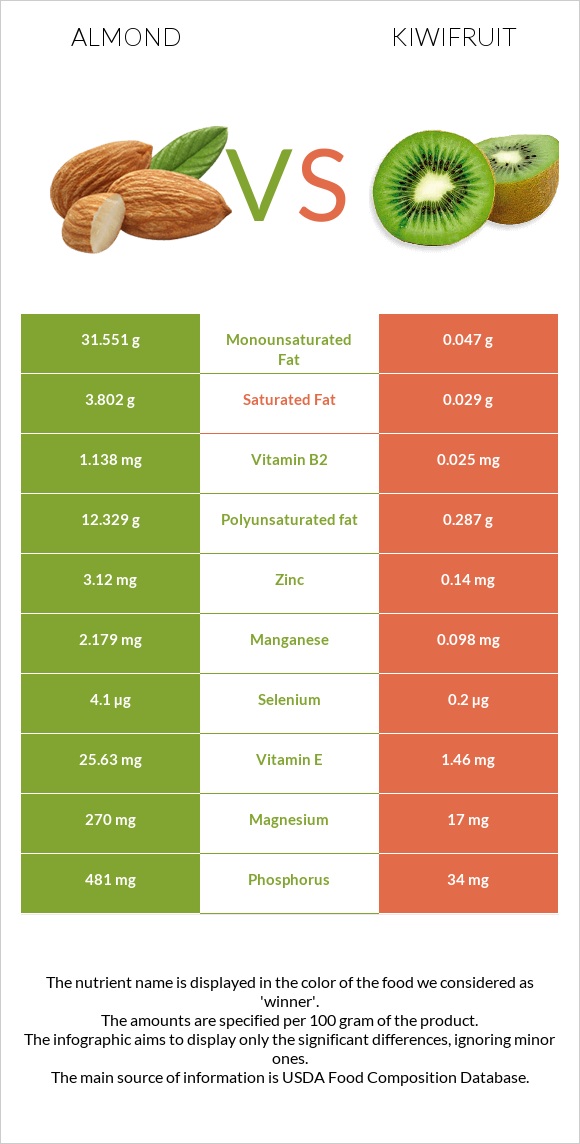
How are almonds and kiwi different? Almonds are higher in vitamin E, copper, manganese, vitamin B2, phosphorus, magnesium, iron, and fiber; however, kiwi is richer in vitamin C and vitamin K. Daily need coverage for vitamin E for almonds is 161% higher. Almonds contain 46 times more vitamin B2 than kiwi. While almonds contain 1.138mg of vitamin B2, kiwi contains only 0.025mg. Almonds have a lower glycemic index (0) than kiwi (58). Nuts, almonds and Kiwifruit, green, raw are the varieties used in this article.
Infographic
Mineral Comparison
Mineral comparison score is based on the number of minerals by which one or the other food is richer. The "coverage" charts below show how much of the daily needs can be covered by 300 grams of the food.
10
100 g
300 g
1 almond - 1.2g 1 oz (23 whole kernels) - 28.35g 1 cup, sliced - 92g 1 cup, ground - 95g 1 cup, slivered - 108g 1 cup, whole - 143g
Magnesium
Magnesium
Calcium
Calcium
Potassium
Potassium
Iron
Iron
Copper
Copper
Zinc
Zinc
Phosphorus
Phosphorus
Sodium
Sodium
Manganese
Manganese
Selenium
Selenium
193%
81%
65%
139%
344%
85%
206%
0.13%
284%
22%
0
100 g
300 g
1 fruit (2" dia) - 69g 1 NLEA serving - 148g 1 cup, sliced - 180g
Magnesium
Magnesium
Calcium
Calcium
Potassium
Potassium
Iron
Iron
Copper
Copper
Zinc
Zinc
Phosphorus
Phosphorus
Sodium
Sodium
Manganese
Manganese
Selenium
Selenium
12%
10%
28%
12%
43%
3.8%
15%
0.39%
13%
1.1%
Vitamin Comparison
Vitamin comparison score is based on the number of vitamins by which one or the other food is richer. The "coverage" charts below show how much of the daily needs can be covered by 300 grams of the food.
7
100 g
300 g
1 almond - 1.2g 1 oz (23 whole kernels) - 28.35g 1 cup, sliced - 92g 1 cup, ground - 95g 1 cup, slivered - 108g 1 cup, whole - 143g
Vitamin C
Vit. C
Vitamin D
Vit. D
Vitamin A
Vit. A
Vitamin E
Vit. E
Vitamin B1
Vit. B1
Vitamin B2
Vit. B2
Vitamin B3
Vit. B3
Vitamin B5
Vit. B5
Vitamin B6
Vit. B6
Vitamin B12
Vit. B12
Vitamin K
Vit. K
Folate
Folate
0%
0%
0%
513%
51%
263%
68%
28%
32%
0%
0%
33%
3
100 g
300 g
1 fruit (2" dia) - 69g 1 NLEA serving - 148g 1 cup, sliced - 180g
Vitamin C
Vit. C
Vitamin D
Vit. D
Vitamin A
Vit. A
Vitamin E
Vit. E
Vitamin B1
Vit. B1
Vitamin B2
Vit. B2
Vitamin B3
Vit. B3
Vitamin B5
Vit. B5
Vitamin B6
Vit. B6
Vitamin B12
Vit. B12
Vitamin K
Vit. K
Folate
Folate
309%
0%
1.3%
29%
6.8%
5.8%
6.4%
11%
15%
0%
101%
19%
All nutrients comparison - raw data values
Nutrient
DV% diff.
Vitamin E
25.63mg
1.46mg
161%
Vitamin C
0mg
92.7mg
103%
Copper
1.031mg
0.13mg
100%
Manganese
2.179mg
0.098mg
90%
Vitamin B2
1.138mg
0.025mg
86%
Polyunsaturated fat
12.329g
0.287g
80%
Monounsaturated fat
31.551g
0.047g
79%
Fats
49.93g
0.52g
76%
Phosphorus
481mg
34mg
64%
Magnesium
270mg
17mg
60%
Iron
3.71mg
0.31mg
43%
Protein
21.15g
1.14g
40%
Fiber
12.5g
3g
38%
Vitamin K
0µg
40.3µg
34%
Zinc
3.12mg
0.14mg
27%
Calories
579kcal
61kcal
26%
Calcium
269mg
34mg
24%
Vitamin B3
3.618mg
0.341mg
20%
Saturated fat
3.802g
0.029g
17%
Vitamin B1
0.205mg
0.027mg
15%
Potassium
733mg
312mg
12%
Choline
52.1mg
7.8mg
8%
Selenium
4.1µg
0.2µg
7%
Vitamin B5
0.471mg
0.183mg
6%
Vitamin B6
0.137mg
0.063mg
6%
Folate
44µg
25µg
5%
Fructose
0.11g
4.35g
5%
Carbs
21.55g
14.66g
2%
Protein per 100 calories
3.7g
1.9g
N/A
Calories per 10 g protein
274kcal
535kcal
N/A
Weight per 100 calories
17g
164g
N/A
Unsaturated / Saturated Fat ratio
12
12
N/A
Net carbs
9.05g
11.66g
N/A
Sugar
4.35g
8.99g
N/A
Starch
0.72g
0g
0%
Sodium
1mg
3mg
0%
Vitamin A
0µg
4µg
0%
Trans fat
0.015g
0g
N/A
Tryptophan
0.211mg
0.015mg
0%
Threonine
0.601mg
0.047mg
0%
Isoleucine
0.751mg
0.051mg
0%
Leucine
1.473mg
0.066mg
0%
Lysine
0.568mg
0.061mg
0%
Methionine
0.157mg
0.024mg
0%
Phenylalanine
1.132mg
0.044mg
0%
Valine
0.855mg
0.057mg
0%
Histidine
0.539mg
0.027mg
0%
Omega-3 - ALA
0.003g
N/A
Omega-6 - Eicosadienoic acid
0.002g
N/A
Omega-6 - Linoleic acid
12.32g
N/A
Macronutrient Comparison
Macronutrient breakdown side-by-side comparison
4
21%
50%
22%
4%
3%
Protein:
21.15 g
Fats:
49.93 g
Carbs:
21.55 g
Water:
4.41 g
Other:
2.96 g
1
15%
83%
Protein:
1.14 g
Fats:
0.52 g
Carbs:
14.66 g
Water:
83.07 g
Other:
0.61 g
Contains
more
Protein Protein
+1755.3%
Contains
more
Fats Fats
+9501.9%
Contains
more
Carbs Carbs
+47%
Contains
more
Other Other
+385.2%
Contains
more
Water Water
+1783.7%
Fat Type Comparison
Fat type breakdown side-by-side comparison
2
8%
66%
26%
Saturated fat:
Sat. Fat
3.802 g
Monounsaturated fat:
Mono. Fat
31.551 g
Polyunsaturated fat:
Poly. Fat
12.329 g
1
8%
13%
79%
Saturated fat:
Sat. Fat
0.029 g
Monounsaturated fat:
Mono. Fat
0.047 g
Polyunsaturated fat:
Poly. Fat
0.287 g
Contains
more
Mono. Fat Monounsaturated fat
+67029.8%
Contains
more
Poly. Fat Polyunsaturated fat
+4195.8%
Contains
less
Sat. Fat Saturated fat
-99.2%
Carbohydrate type comparison
Carbohydrate type breakdown side-by-side comparison
2
14%
78%
3%
2%
Starch:
0.72 g
Sucrose:
3.95 g
Glucose:
0.17 g
Fructose:
0.11 g
Lactose:
0 g
Maltose:
0.04 g
Galactose:
0.07 g
4
2%
46%
48%
2%
2%
Starch:
0 g
Sucrose:
0.15 g
Glucose:
4.11 g
Fructose:
4.35 g
Lactose:
0 g
Maltose:
0.19 g
Galactose:
0.17 g
Contains
more
Starch Starch
+∞%
Contains
more
Sucrose Sucrose
+2533.3%
Contains
more
Glucose Glucose
+2317.6%
Contains
more
Fructose Fructose
+3854.5%
Contains
more
Maltose Maltose
+375%
Contains
more
Galactose Galactose
+142.9%