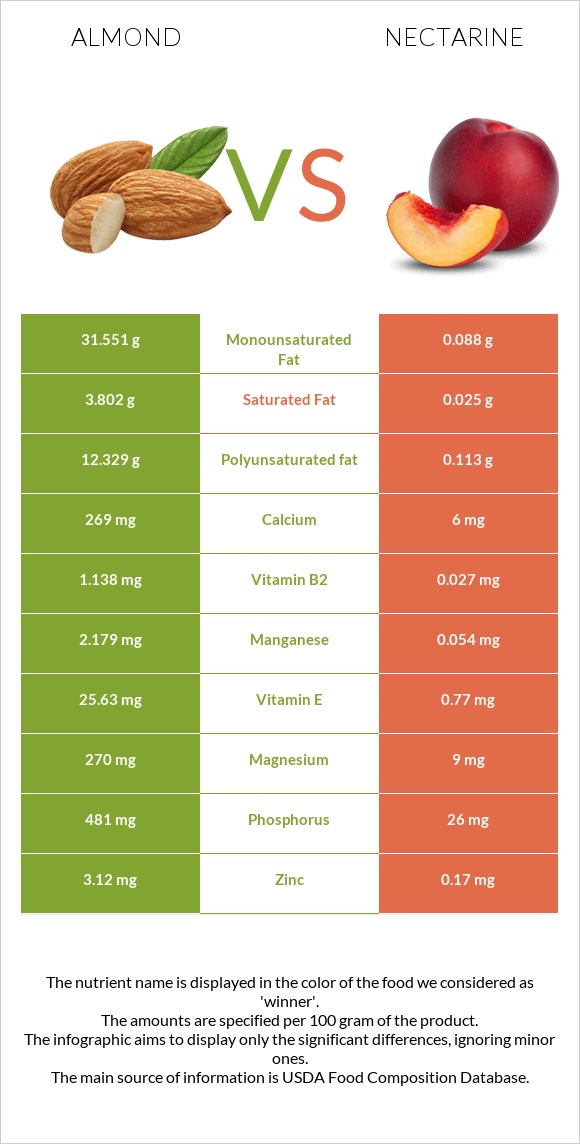
Important differences between almonds and nectarine Almonds have more vitamin E, copper, manganese, vitamin B2, phosphorus, magnesium, fiber, iron, zinc, and calcium than nectarine. Almonds' daily need coverage for vitamin E is 166% more. Almonds contain 45 times more calcium than nectarine. Almonds contain 269mg of calcium, while nectarine contains 6mg. Nectarine has a higher glycemic index. The glycemic index of nectarine is 43, while the glycemic index of almonds is 0. The food varieties used in the comparison are Nuts, almonds and Nectarines, raw .
Infographic
Mineral Comparison
Mineral comparison score is based on the number of minerals by which one or the other food is richer. The "coverage" charts below show how much of the daily needs can be covered by 300 grams of the food.
9
100 g
300 g
1 almond - 1.2g 1 oz (23 whole kernels) - 28.35g 1 cup, sliced - 92g 1 cup, ground - 95g 1 cup, slivered - 108g 1 cup, whole - 143g
Magnesium
Magnesium
Calcium
Calcium
Potassium
Potassium
Iron
Iron
Copper
Copper
Zinc
Zinc
Phosphorus
Phosphorus
Sodium
Sodium
Manganese
Manganese
Selenium
Selenium
193%
81%
65%
139%
344%
85%
206%
0.13%
284%
22%
1
100 g
300 g
1 small (2-1/3" dia) - 129g 1 NLEA serving - 140g 1 medium (2-1/2" dia) - 142g 1 cup slices - 143g 1 large (2-3/4" dia) - 156g
Magnesium
Magnesium
Calcium
Calcium
Potassium
Potassium
Iron
Iron
Copper
Copper
Zinc
Zinc
Phosphorus
Phosphorus
Sodium
Sodium
Manganese
Manganese
Selenium
Selenium
6.4%
1.8%
18%
11%
29%
4.6%
11%
0%
7%
0%
Vitamin Comparison
Vitamin comparison score is based on the number of vitamins by which one or the other food is richer. The "coverage" charts below show how much of the daily needs can be covered by 300 grams of the food.
7
100 g
300 g
1 almond - 1.2g 1 oz (23 whole kernels) - 28.35g 1 cup, sliced - 92g 1 cup, ground - 95g 1 cup, slivered - 108g 1 cup, whole - 143g
Vitamin C
Vit. C
Vitamin D
Vit. D
Vitamin A
Vit. A
Vitamin E
Vit. E
Vitamin B1
Vit. B1
Vitamin B2
Vit. B2
Vitamin B3
Vit. B3
Vitamin B5
Vit. B5
Vitamin B6
Vit. B6
Vitamin B12
Vit. B12
Vitamin K
Vit. K
Folate
Folate
0%
0%
0%
513%
51%
263%
68%
28%
32%
0%
0%
33%
3
100 g
300 g
1 small (2-1/3" dia) - 129g 1 NLEA serving - 140g 1 medium (2-1/2" dia) - 142g 1 cup slices - 143g 1 large (2-3/4" dia) - 156g
Vitamin C
Vit. C
Vitamin D
Vit. D
Vitamin A
Vit. A
Vitamin E
Vit. E
Vitamin B1
Vit. B1
Vitamin B2
Vit. B2
Vitamin B3
Vit. B3
Vitamin B5
Vit. B5
Vitamin B6
Vit. B6
Vitamin B12
Vit. B12
Vitamin K
Vit. K
Folate
Folate
18%
0%
5.7%
15%
8.5%
6.2%
21%
11%
5.8%
0%
5.5%
3.8%
All nutrients comparison - raw data values
Nutrient
DV% diff.
Vitamin E
25.63mg
0.77mg
166%
Copper
1.031mg
0.086mg
105%
Manganese
2.179mg
0.054mg
92%
Vitamin B2
1.138mg
0.027mg
85%
Polyunsaturated fat
12.329g
0.113g
81%
Monounsaturated fat
31.551g
0.088g
79%
Fats
49.93g
0.32g
76%
Phosphorus
481mg
26mg
65%
Magnesium
270mg
9mg
62%
Iron
3.71mg
0.28mg
43%
Fiber
12.5g
1.7g
43%
Protein
21.15g
1.06g
40%
Calories
579kcal
44kcal
27%
Zinc
3.12mg
0.17mg
27%
Calcium
269mg
6mg
26%
Saturated fat
3.802g
0.025g
17%
Potassium
733mg
201mg
16%
Vitamin B3
3.618mg
1.125mg
16%
Vitamin B1
0.205mg
0.034mg
14%
Folate
44µg
5µg
10%
Vitamin B6
0.137mg
0.025mg
9%
Choline
52.1mg
6.2mg
8%
Selenium
4.1µg
0µg
7%
Vitamin C
0mg
5.4mg
6%
Vitamin B5
0.471mg
0.185mg
6%
Carbs
21.55g
10.55g
4%
Vitamin A
0µg
17µg
2%
Vitamin K
0µg
2.2µg
2%
Fructose
0.11g
1.37g
2%
Protein per 100 calories
3.7g
2.4g
N/A
Calories per 10 g protein
274kcal
415kcal
N/A
Weight per 100 calories
17g
227g
N/A
Unsaturated / Saturated Fat ratio
12
8
N/A
Net carbs
9.05g
8.85g
N/A
Sugar
4.35g
7.89g
N/A
Starch
0.72g
0.07g
0%
Sodium
1mg
0mg
0%
Trans fat
0.015g
0g
N/A
Tryptophan
0.211mg
0.005mg
0%
Threonine
0.601mg
0.009mg
0%
Isoleucine
0.751mg
0.009mg
0%
Leucine
1.473mg
0.014mg
0%
Lysine
0.568mg
0.016mg
0%
Methionine
0.157mg
0.006mg
0%
Phenylalanine
1.132mg
0.021mg
0%
Valine
0.855mg
0.013mg
0%
Histidine
0.539mg
0.008mg
0%
Omega-3 - ALA
0.003g
N/A
Omega-6 - Eicosadienoic acid
0.002g
N/A
Omega-6 - Linoleic acid
12.32g
N/A
Macronutrient Comparison
Macronutrient breakdown side-by-side comparison
4
21%
50%
22%
4%
3%
Protein:
21.15 g
Fats:
49.93 g
Carbs:
21.55 g
Water:
4.41 g
Other:
2.96 g
1
11%
88%
Protein:
1.06 g
Fats:
0.32 g
Carbs:
10.55 g
Water:
87.59 g
Other:
0.48 g
Contains
more
Protein Protein
+1895.3%
Contains
more
Fats Fats
+15503.1%
Contains
more
Carbs Carbs
+104.3%
Contains
more
Other Other
+516.7%
Contains
more
Water Water
+1886.2%
Fat Type Comparison
Fat type breakdown side-by-side comparison
2
8%
66%
26%
Saturated fat:
Sat. Fat
3.802 g
Monounsaturated fat:
Mono. Fat
31.551 g
Polyunsaturated fat:
Poly. Fat
12.329 g
1
11%
39%
50%
Saturated fat:
Sat. Fat
0.025 g
Monounsaturated fat:
Mono. Fat
0.088 g
Polyunsaturated fat:
Poly. Fat
0.113 g
Contains
more
Mono. Fat Monounsaturated fat
+35753.4%
Contains
more
Poly. Fat Polyunsaturated fat
+10810.6%
Contains
less
Sat. Fat Saturated fat
-99.3%
Carbohydrate type comparison
Carbohydrate type breakdown side-by-side comparison
3
14%
78%
3%
2%
Starch:
0.72 g
Sucrose:
3.95 g
Glucose:
0.17 g
Fructose:
0.11 g
Lactose:
0 g
Maltose:
0.04 g
Galactose:
0.07 g
3
62%
20%
17%
Starch:
0.07 g
Sucrose:
4.87 g
Glucose:
1.57 g
Fructose:
1.37 g
Lactose:
0 g
Maltose:
0 g
Galactose:
0 g
Contains
more
Starch Starch
+928.6%
Contains
more
Maltose Maltose
+∞%
Contains
more
Galactose Galactose
+∞%
Contains
more
Sucrose Sucrose
+23.3%
Contains
more
Glucose Glucose
+823.5%
Contains
more
Fructose Fructose
+1145.5%