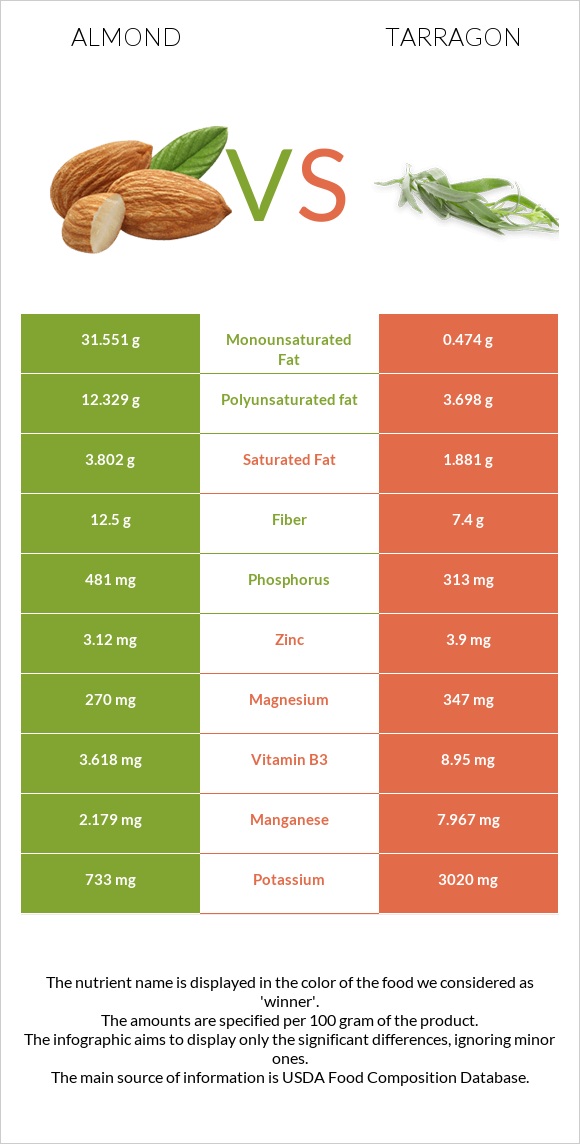
Important differences between almonds and tarragon Almonds have more copper; however, tarragon is richer in iron, manganese, vitamin B6, calcium, vitamin A, potassium, folate, vitamin C, and vitamin B3. Tarragon's daily need coverage for iron is 357% more. Almonds contain 2 times more copper than tarragon. Almonds contain 1.031mg of copper, while tarragon contains 0.677mg. The food varieties used in the comparison are Nuts, almonds and Spices, tarragon, dried .
Infographic
Mineral Comparison
Mineral comparison score is based on the number of minerals by which one or the other food is richer. The "coverage" charts below show how much of the daily needs can be covered by 300 grams of the food.
3
100 g
300 g
1 almond - 1.2g 1 oz (23 whole kernels) - 28.35g 1 cup, sliced - 92g 1 cup, ground - 95g 1 cup, slivered - 108g 1 cup, whole - 143g
Magnesium
Magnesium
Calcium
Calcium
Potassium
Potassium
Iron
Iron
Copper
Copper
Zinc
Zinc
Phosphorus
Phosphorus
Sodium
Sodium
Manganese
Manganese
Selenium
Selenium
193%
81%
65%
139%
344%
85%
206%
0.13%
284%
22%
6
100 g
300 g
0.25 tsp - 0.5g 1 tsp, ground - 1.6g 1 tbsp, leaves - 1.8g 1 tbsp, ground - 4.8g
Magnesium
Magnesium
Calcium
Calcium
Potassium
Potassium
Iron
Iron
Copper
Copper
Zinc
Zinc
Phosphorus
Phosphorus
Sodium
Sodium
Manganese
Manganese
Selenium
Selenium
248%
342%
266%
1211%
226%
106%
134%
8.1%
1039%
24%
Vitamin Comparison
Vitamin comparison score is based on the number of vitamins by which one or the other food is richer. The "coverage" charts below show how much of the daily needs can be covered by 300 grams of the food.
2
100 g
300 g
1 almond - 1.2g 1 oz (23 whole kernels) - 28.35g 1 cup, sliced - 92g 1 cup, ground - 95g 1 cup, slivered - 108g 1 cup, whole - 143g
Vitamin C
Vit. C
Vitamin D
Vit. D
Vitamin A
Vit. A
Vitamin E
Vit. E
Vitamin B1
Vit. B1
Vitamin B2
Vit. B2
Vitamin B3
Vit. B3
Vitamin B5
Vit. B5
Vitamin B6
Vit. B6
Vitamin B12
Vit. B12
Vitamin K
Vit. K
Folate
Folate
0%
0%
0%
513%
51%
263%
68%
28%
32%
0%
0%
33%
7
100 g
300 g
0.25 tsp - 0.5g 1 tsp, ground - 1.6g 1 tbsp, leaves - 1.8g 1 tbsp, ground - 4.8g
Vitamin C
Vit. C
Vitamin D
Vit. D
Vitamin A
Vit. A
Vitamin E
Vit. E
Vitamin B1
Vit. B1
Vitamin B2
Vit. B2
Vitamin B3
Vit. B3
Vitamin B5
Vit. B5
Vitamin B6
Vit. B6
Vitamin B12
Vit. B12
Vitamin K
Vit. K
Folate
Folate
167%
0%
70%
0%
63%
309%
168%
0%
556%
0%
0%
206%
All nutrients comparison - raw data values
Nutrient
DV% diff.
Iron
3.71mg
32.3mg
357%
Manganese
2.179mg
7.967mg
252%
Vitamin B6
0.137mg
2.41mg
175%
Vitamin E
25.63mg
171%
Calcium
269mg
1139mg
87%
Monounsaturated fat
31.551g
0.474g
78%
Potassium
733mg
3020mg
67%
Fats
49.93g
7.24g
66%
Folate
44µg
274µg
58%
Polyunsaturated fat
12.329g
3.698g
58%
Vitamin C
0mg
50mg
56%
Copper
1.031mg
0.677mg
39%
Vitamin B3
3.618mg
8.95mg
33%
Phosphorus
481mg
313mg
24%
Vitamin A
0µg
210µg
23%
Fiber
12.5g
7.4g
20%
Magnesium
270mg
347mg
18%
Vitamin B2
1.138mg
1.339mg
15%
Calories
579kcal
295kcal
14%
Carbs
21.55g
50.22g
10%
Vitamin B5
0.471mg
9%
Choline
52.1mg
9%
Saturated fat
3.802g
1.881g
9%
Zinc
3.12mg
3.9mg
7%
Vitamin B1
0.205mg
0.251mg
4%
Protein
21.15g
22.77g
3%
Sodium
1mg
62mg
3%
Selenium
4.1µg
4.4µg
1%
Protein per 100 calories
3.7g
7.7g
N/A
Calories per 10 g protein
274kcal
130kcal
N/A
Weight per 100 calories
17g
34g
N/A
Unsaturated / Saturated Fat ratio
12
2.2
N/A
Net carbs
9.05g
42.82g
N/A
Sugar
4.35g
N/A
Starch
0.72g
0%
Trans fat
0.015g
0g
N/A
Tryptophan
0.211mg
0%
Threonine
0.601mg
0%
Isoleucine
0.751mg
0%
Leucine
1.473mg
0%
Lysine
0.568mg
0%
Methionine
0.157mg
0%
Phenylalanine
1.132mg
0%
Valine
0.855mg
0%
Histidine
0.539mg
0%
Fructose
0.11g
0%
Omega-3 - ALA
0.003g
N/A
Omega-6 - Eicosadienoic acid
0.002g
N/A
Omega-6 - Linoleic acid
12.32g
N/A
Macronutrient Comparison
Macronutrient breakdown side-by-side comparison
1
21%
50%
22%
4%
3%
Protein:
21.15 g
Fats:
49.93 g
Carbs:
21.55 g
Water:
4.41 g
Other:
2.96 g
4
23%
7%
50%
8%
12%
Protein:
22.77 g
Fats:
7.24 g
Carbs:
50.22 g
Water:
7.74 g
Other:
12.03 g
Contains
more
Fats Fats
+589.6%
Contains
more
Carbs Carbs
+133%
Contains
more
Water Water
+75.5%
Contains
more
Other Other
+306.4%
~equal in
Protein
~22.77g
Fat Type Comparison
Fat type breakdown side-by-side comparison
2
8%
66%
26%
Saturated fat:
Sat. Fat
3.802 g
Monounsaturated fat:
Mono. Fat
31.551 g
Polyunsaturated fat:
Poly. Fat
12.329 g
1
31%
8%
61%
Saturated fat:
Sat. Fat
1.881 g
Monounsaturated fat:
Mono. Fat
0.474 g
Polyunsaturated fat:
Poly. Fat
3.698 g
Contains
more
Mono. Fat Monounsaturated fat
+6556.3%
Contains
more
Poly. Fat Polyunsaturated fat
+233.4%
Contains
less
Sat. Fat Saturated fat
-50.5%