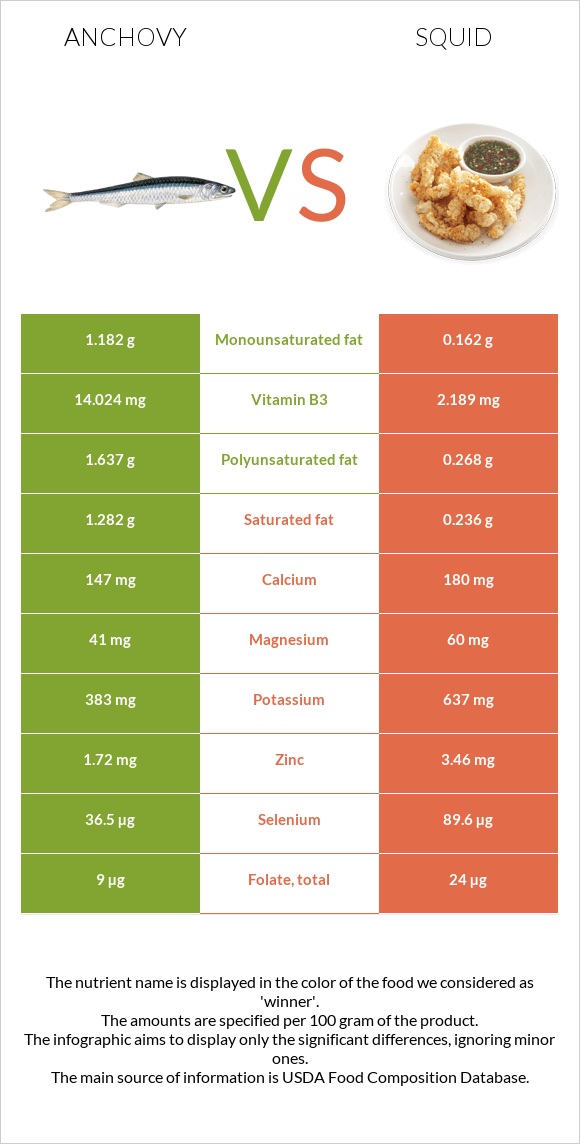
Significant differences between anchovies and squid Anchovies have more vitamin B3; however, squid is richer in vitamin B12, vitamin B2, selenium, iron, copper, phosphorus, and zinc. Squid covers your daily vitamin B12 needs 199% more than anchovies. Squid has 6 times less vitamin B3 than anchovies. Anchovies have 14.024mg of vitamin B3, while squid has 2.189mg. Anchovies contain less cholesterol. Specific food types used in this comparison are Fish, anchovy, european, raw and Mollusks, cuttlefish, mixed species, cooked, moist heat .
Infographic
Mineral Comparison
Mineral comparison score is based on the number of minerals by which one or the other food is richer. The "coverage" charts below show how much of the daily needs can be covered by 300 grams of the food.
1
100 g
300 g
3 oz - 85g
Magnesium
Magnesium
Calcium
Calcium
Potassium
Potassium
Iron
Iron
Copper
Copper
Zinc
Zinc
Phosphorus
Phosphorus
Sodium
Sodium
Manganese
Manganese
Selenium
Selenium
29%
44%
34%
122%
70%
47%
75%
14%
9.1%
199%
9
100 g
300 g
3 oz - 85g
Magnesium
Magnesium
Calcium
Calcium
Potassium
Potassium
Iron
Iron
Copper
Copper
Zinc
Zinc
Phosphorus
Phosphorus
Sodium
Sodium
Manganese
Manganese
Selenium
Selenium
43%
54%
56%
407%
333%
94%
249%
97%
27%
489%
Vitamin Comparison
Vitamin comparison score is based on the number of vitamins by which one or the other food is richer. The "coverage" charts below show how much of the daily needs can be covered by 300 grams of the food.
4
100 g
300 g
3 oz - 85g
Vitamin C
Vit. C
Vitamin D
Vit. D
Vitamin A
Vit. A
Vitamin E
Vit. E
Vitamin B1
Vit. B1
Vitamin B2
Vit. B2
Vitamin B3
Vit. B3
Vitamin B5
Vit. B5
Vitamin B6
Vit. B6
Vitamin B12
Vit. B12
Vitamin K
Vit. K
Folate
Folate
0%
0%
5%
11%
14%
59%
263%
39%
33%
78%
0.25%
6.8%
7
100 g
300 g
3 oz - 85g
Vitamin C
Vit. C
Vitamin D
Vit. D
Vitamin A
Vit. A
Vitamin E
Vit. E
Vitamin B1
Vit. B1
Vitamin B2
Vit. B2
Vitamin B3
Vit. B3
Vitamin B5
Vit. B5
Vitamin B6
Vit. B6
Vitamin B12
Vit. B12
Vitamin K
Vit. K
Folate
Folate
28%
0%
68%
0%
4.3%
399%
41%
54%
62%
675%
0%
18%
All nutrients comparison - raw data values
Nutrient
DV% diff.
Vitamin B12
0.62µg
5.4µg
199%
Vitamin B2
0.256mg
1.729mg
113%
Selenium
36.5µg
89.6µg
97%
Iron
3.25mg
10.84mg
95%
Copper
0.211mg
0.998mg
87%
Vitamin B3
14.024mg
2.189mg
74%
Phosphorus
174mg
580mg
58%
Cholesterol
60mg
224mg
55%
Sodium
104mg
744mg
28%
Protein
20.35g
32.48g
24%
Vitamin A
15µg
203µg
21%
Zinc
1.72mg
3.46mg
16%
Vitamin B6
0.143mg
0.27mg
10%
Vitamin C
0mg
8.5mg
9%
Polyunsaturated fat
1.637g
0.268g
9%
Potassium
383mg
637mg
7%
Manganese
0.07mg
0.209mg
6%
Fats
4.84g
1.4g
5%
Magnesium
41mg
60mg
5%
Vitamin B5
0.645mg
0.9mg
5%
Saturated fat
1.282g
0.236g
5%
Vitamin E
0.57mg
4%
Folate
9µg
24µg
4%
Calcium
147mg
180mg
3%
Vitamin B1
0.055mg
0.017mg
3%
Monounsaturated fat
1.182g
0.162g
3%
Calories
131kcal
158kcal
1%
Carbs
0g
1.64g
1%
Protein per 100 calories
16g
21g
N/A
Calories per 10 g protein
64kcal
49kcal
N/A
Weight per 100 calories
76g
63g
N/A
Unsaturated / Saturated Fat ratio
2.2
1.8
N/A
Net carbs
0g
1.64g
N/A
Vitamin K
0.1µg
0%
Tryptophan
0.228mg
0.364mg
0%
Threonine
0.892mg
1.398mg
0%
Isoleucine
0.938mg
1.414mg
0%
Leucine
1.654mg
2.287mg
0%
Lysine
1.869mg
2.427mg
0%
Methionine
0.602mg
0.733mg
0%
Phenylalanine
0.794mg
1.164mg
0%
Valine
1.048mg
1.419mg
0%
Histidine
0.599mg
0.624mg
0%
Omega-3 - EPA
0.538g
0.078g
N/A
Omega-3 - DHA
0.911g
0.132g
N/A
Omega-3 - DPA
0.029g
0.012g
N/A
Macronutrient Comparison
Macronutrient breakdown side-by-side comparison
2
20%
5%
73%
Protein:
20.35 g
Fats:
4.84 g
Carbs:
0 g
Water:
73.37 g
Other:
1.44 g
3
32%
61%
3%
Protein:
32.48 g
Fats:
1.4 g
Carbs:
1.64 g
Water:
61.12 g
Other:
3.36 g
Contains
more
Fats Fats
+245.7%
Contains
more
Water Water
+20%
Contains
more
Protein Protein
+59.6%
Contains
more
Carbs Carbs
+∞%
Contains
more
Other Other
+133.3%
Fat Type Comparison
Fat type breakdown side-by-side comparison
2
31%
29%
40%
Saturated fat:
Sat. Fat
1.282 g
Monounsaturated fat:
Mono. Fat
1.182 g
Polyunsaturated fat:
Poly. Fat
1.637 g
1
35%
24%
40%
Saturated fat:
Sat. Fat
0.236 g
Monounsaturated fat:
Mono. Fat
0.162 g
Polyunsaturated fat:
Poly. Fat
0.268 g
Contains
more
Mono. Fat Monounsaturated fat
+629.6%
Contains
more
Poly. Fat Polyunsaturated fat
+510.8%
Contains
less
Sat. Fat Saturated fat
-81.6%