Babassu oil vs. Baking powder — In-Depth Nutrition Comparison
Compare
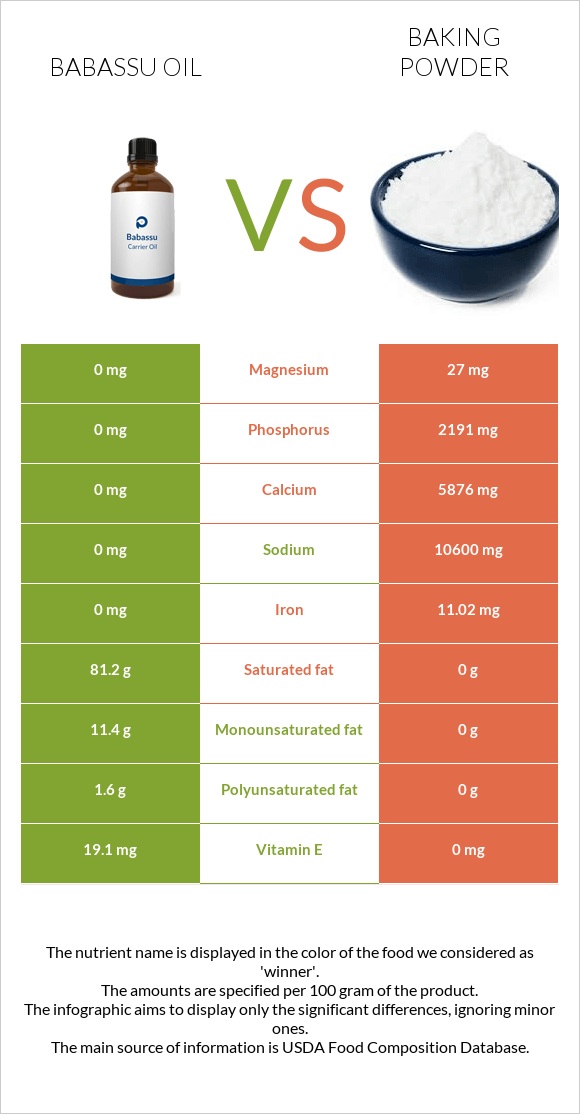
Summary of differences between babassu oil and baking powder
- Babassu oil has more vitamin E, monounsaturated fat, and polyunsaturated fat; however, baking powder is higher in calcium, phosphorus, iron, and magnesium.
- Baking powder covers your daily need for calcium, 588% more than babassu oil.
- The glycemic index of baking powder is higher.
These are the specific foods used in this comparison Oil, babassu and Leavening agents, baking powder, double-acting, sodium aluminum sulfate.
Infographic
Infographic link
Mineral Comparison
Mineral comparison score is based on the number of minerals by which one or the other food is richer. The "coverage" charts below show how much of the daily needs can be covered by 300 grams of the food.
| Contains less SodiumSodium | -100% |
| Contains more MagnesiumMagnesium | +∞% |
| Contains more CalciumCalcium | +∞% |
| Contains more PotassiumPotassium | +∞% |
| Contains more IronIron | +∞% |
| Contains more ZincZinc | +∞% |
| Contains more PhosphorusPhosphorus | +∞% |
| Contains more SeleniumSelenium | +∞% |
Vitamin Comparison
Vitamin comparison score is based on the number of vitamins by which one or the other food is richer. The "coverage" charts below show how much of the daily needs can be covered by 300 grams of the food.
| Contains more Vitamin EVitamin E | +∞% |
All nutrients comparison - raw data values
| Nutrient |  |
 |
DV% diff. |
| Calcium | 0mg | 5876mg | 588% |
| Sodium | 0mg | 10600mg | 461% |
| Saturated fat | 81.2g | 0g | 369% |
| Phosphorus | 0mg | 2191mg | 313% |
| Fats | 100g | 0g | 154% |
| Iron | 0mg | 11.02mg | 138% |
| Vitamin E | 19.1mg | 0mg | 127% |
| Calories | 884kcal | 53kcal | 42% |
| Monounsaturated fat | 11.4g | 0g | 29% |
| Polyunsaturated fat | 1.6g | 0g | 11% |
| Carbs | 0g | 27.7g | 9% |
| Magnesium | 0mg | 27mg | 6% |
| Potassium | 0mg | 20mg | 1% |
| Fiber | 0g | 0.2g | 1% |
| Copper | 0.01mg | 1% | |
| Net carbs | 0g | 27.5g | N/A |
| Zinc | 0mg | 0.01mg | 0% |
| Manganese | 0.011mg | 0% | |
| Selenium | 0µg | 0.2µg | 0% |
Macronutrient Comparison
Macronutrient breakdown side-by-side comparison
Protein:
0 g
Fats:
100 g
Carbs:
0 g
Water:
0 g
Other:
0 g
Protein:
0 g
Fats:
0 g
Carbs:
27.7 g
Water:
5 g
Other:
67.3 g
| Contains more FatsFats | +∞% |
| Contains more CarbsCarbs | +∞% |
| Contains more WaterWater | +∞% |
| Contains more OtherOther | +∞% |
~equal in
Protein
~0g


