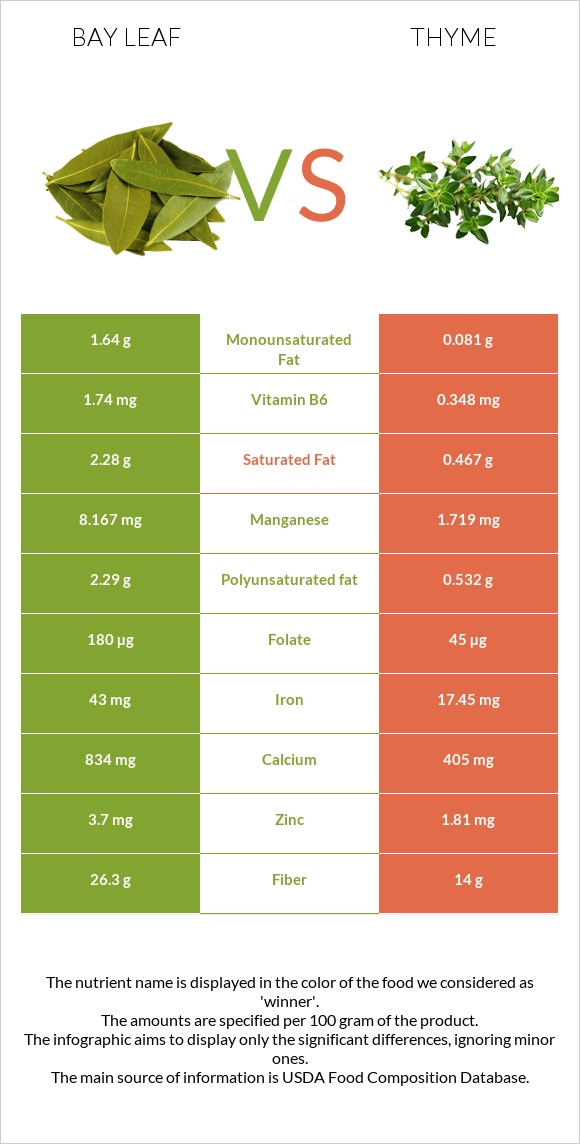
Summary of differences between bay leaf and thyme Bay leaf has more iron, manganese, vitamin B6, fiber, calcium, folate, vitamin A, and zinc; however, thyme is higher in vitamin C and copper. Bay leaf covers your daily need for iron, 319% more than thyme. Bay leaf has 5 times more vitamin B6 than thyme. While bay leaf has 1.74mg of vitamin B6, thyme has only 0.348mg. These are the specific foods used in this comparison Spices, bay leaf and Thyme, fresh .
Infographic
Mineral Comparison
Mineral comparison score is based on the number of minerals by which one or the other food is richer. The "coverage" charts below show how much of the daily needs can be covered by 300 grams of the food.
5
100 g
300 g
1 tsp, crumbled - 0.6g 1 tbsp, crumbled - 1.8g
Magnesium
Magnesium
Calcium
Calcium
Potassium
Potassium
Iron
Iron
Copper
Copper
Zinc
Zinc
Phosphorus
Phosphorus
Sodium
Sodium
Manganese
Manganese
Selenium
Selenium
86%
250%
47%
1613%
139%
101%
48%
3%
1065%
15%
4
100 g
300 g
0.5 tsp - 0.4g 1 tsp - 0.8g
Magnesium
Magnesium
Calcium
Calcium
Potassium
Potassium
Iron
Iron
Copper
Copper
Zinc
Zinc
Phosphorus
Phosphorus
Sodium
Sodium
Manganese
Manganese
Selenium
Selenium
114%
122%
54%
654%
185%
49%
45%
1.2%
224%
0%
Vitamin Comparison
Vitamin comparison score is based on the number of vitamins by which one or the other food is richer. The "coverage" charts below show how much of the daily needs can be covered by 300 grams of the food.
3
100 g
300 g
1 tsp, crumbled - 0.6g 1 tbsp, crumbled - 1.8g
Vitamin C
Vit. C
Vitamin D
Vit. D
Vitamin A
Vit. A
Vitamin E
Vit. E
Vitamin B1
Vit. B1
Vitamin B2
Vit. B2
Vitamin B3
Vit. B3
Vitamin B5
Vit. B5
Vitamin B6
Vit. B6
Vitamin B12
Vit. B12
Vitamin K
Vit. K
Folate
Folate
155%
0%
103%
0%
2.3%
97%
38%
0%
402%
0%
0%
135%
4
100 g
300 g
0.5 tsp - 0.4g 1 tsp - 0.8g
Vitamin C
Vit. C
Vitamin D
Vit. D
Vitamin A
Vit. A
Vitamin E
Vit. E
Vitamin B1
Vit. B1
Vitamin B2
Vit. B2
Vitamin B3
Vit. B3
Vitamin B5
Vit. B5
Vitamin B6
Vit. B6
Vitamin B12
Vit. B12
Vitamin K
Vit. K
Folate
Folate
534%
0%
79%
0%
12%
109%
34%
25%
80%
0%
0%
34%
All nutrients comparison - raw data values
Nutrient
DV% diff.
Iron
43mg
17.45mg
319%
Manganese
8.167mg
1.719mg
280%
Vitamin C
46.5mg
160.1mg
126%
Vitamin B6
1.74mg
0.348mg
107%
Fiber
26.3g
14g
49%
Calcium
834mg
405mg
43%
Folate
180µg
45µg
34%
Carbs
74.97g
24.45g
17%
Zinc
3.7mg
1.81mg
17%
Copper
0.416mg
0.555mg
15%
Polyunsaturated fat
2.29g
0.532g
12%
Calories
313kcal
101kcal
11%
Fats
8.36g
1.68g
10%
Magnesium
120mg
160mg
10%
Vitamin A
309µg
238µg
8%
Vitamin B5
0.409mg
8%
Saturated fat
2.28g
0.467g
8%
Selenium
2.8µg
5%
Protein
7.61g
5.56g
4%
Vitamin B2
0.421mg
0.471mg
4%
Monounsaturated fat
1.64g
0.081g
4%
Vitamin B1
0.009mg
0.048mg
3%
Potassium
529mg
609mg
2%
Phosphorus
113mg
106mg
1%
Sodium
23mg
9mg
1%
Vitamin B3
2.005mg
1.824mg
1%
Protein per 100 calories
2.4g
5.5g
N/A
Calories per 10 g protein
411kcal
182kcal
N/A
Weight per 100 calories
32g
99g
N/A
Unsaturated / Saturated Fat ratio
1.7
1.3
N/A
Net carbs
48.67g
10.45g
N/A
Tryptophan
0.114mg
0%
Threonine
0.154mg
0%
Isoleucine
0.285mg
0%
Leucine
0.262mg
0%
Lysine
0.126mg
0%
Valine
0.307mg
0%
Macronutrient Comparison
Macronutrient breakdown side-by-side comparison
4
8%
8%
75%
5%
4%
Protein:
7.61 g
Fats:
8.36 g
Carbs:
74.97 g
Water:
5.44 g
Other:
3.62 g
1
6%
2%
24%
65%
3%
Protein:
5.56 g
Fats:
1.68 g
Carbs:
24.45 g
Water:
65.11 g
Other:
3.2 g
Contains
more
Protein Protein
+36.9%
Contains
more
Fats Fats
+397.6%
Contains
more
Carbs Carbs
+206.6%
Contains
more
Other Other
+13.1%
Contains
more
Water Water
+1096.9%
Fat Type Comparison
Fat type breakdown side-by-side comparison
2
37%
26%
37%
Saturated fat:
Sat. Fat
2.28 g
Monounsaturated fat:
Mono. Fat
1.64 g
Polyunsaturated fat:
Poly. Fat
2.29 g
1
43%
8%
49%
Saturated fat:
Sat. Fat
0.467 g
Monounsaturated fat:
Mono. Fat
0.081 g
Polyunsaturated fat:
Poly. Fat
0.532 g
Contains
more
Mono. Fat Monounsaturated fat
+1924.7%
Contains
more
Poly. Fat Polyunsaturated fat
+330.5%
Contains
less
Sat. Fat Saturated fat
-79.5%