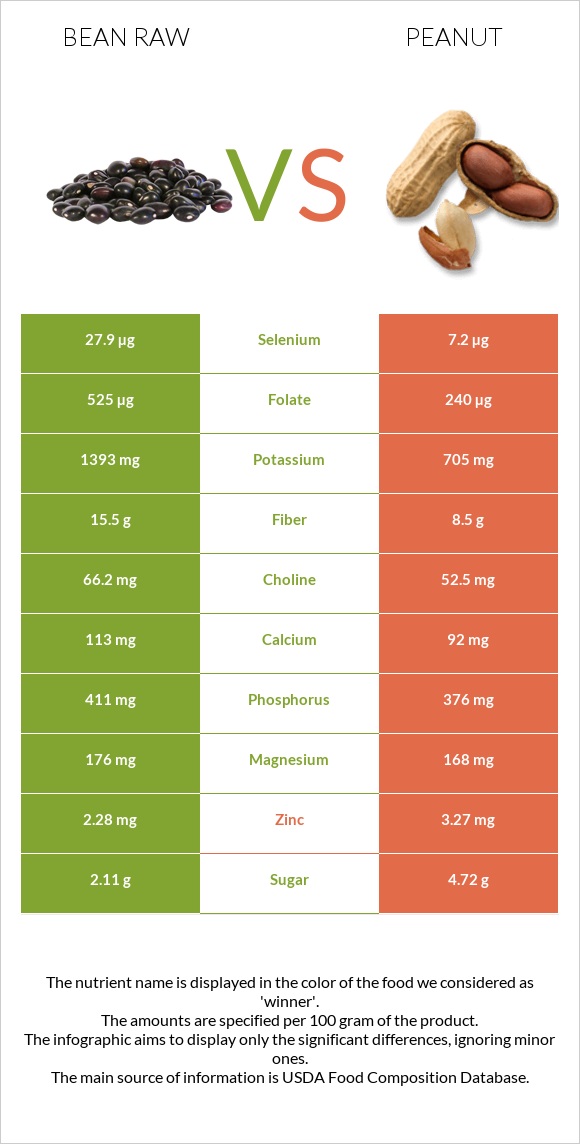
How are bean raw and peanuts different? Bean raw is higher in folate, selenium, fiber, and potassium; however, peanuts are richer in vitamin B3, vitamin E, manganese, copper, and vitamin B5. Daily need coverage for folate for bean raw is 71% higher. Bean raw contains 4 times more selenium than peanuts. While bean raw contains 27.9µg of selenium, peanuts contain only 7.2µg. Bean raw has less saturated fat. Peanuts have a lower glycemic index (13) than bean raw (33). Beans, pinto, mature seeds, raw and Peanuts, all types, raw are the varieties used in this article.
Infographic
Mineral Comparison
Mineral comparison score is based on the number of minerals by which one or the other food is richer. The "coverage" charts below show how much of the daily needs can be covered by 300 grams of the food.
4
100 g
300 g
1 tbsp - 12g 1 cup - 193g
Magnesium
Magnesium
Calcium
Calcium
Potassium
Potassium
Iron
Iron
Copper
Copper
Zinc
Zinc
Phosphorus
Phosphorus
Sodium
Sodium
Manganese
Manganese
Selenium
Selenium
126%
34%
123%
190%
298%
62%
176%
1.6%
150%
152%
3
100 g
300 g
1 oz - 28.35g 1 cup - 146g
Magnesium
Magnesium
Calcium
Calcium
Potassium
Potassium
Iron
Iron
Copper
Copper
Zinc
Zinc
Phosphorus
Phosphorus
Sodium
Sodium
Manganese
Manganese
Selenium
Selenium
120%
28%
62%
172%
381%
89%
161%
2.3%
252%
39%
Vitamin Comparison
Vitamin comparison score is based on the number of vitamins by which one or the other food is richer. The "coverage" charts below show how much of the daily needs can be covered by 300 grams of the food.
6
100 g
300 g
1 tbsp - 12g 1 cup - 193g
Vitamin C
Vit. C
Vitamin D
Vit. D
Vitamin A
Vit. A
Vitamin E
Vit. E
Vitamin B1
Vit. B1
Vitamin B2
Vit. B2
Vitamin B3
Vit. B3
Vitamin B5
Vit. B5
Vitamin B6
Vit. B6
Vitamin B12
Vit. B12
Vitamin K
Vit. K
Folate
Folate
21%
0%
0%
4.2%
178%
49%
22%
47%
109%
0%
14%
394%
3
100 g
300 g
1 oz - 28.35g 1 cup - 146g
Vitamin C
Vit. C
Vitamin D
Vit. D
Vitamin A
Vit. A
Vitamin E
Vit. E
Vitamin B1
Vit. B1
Vitamin B2
Vit. B2
Vitamin B3
Vit. B3
Vitamin B5
Vit. B5
Vitamin B6
Vit. B6
Vitamin B12
Vit. B12
Vitamin K
Vit. K
Folate
Folate
0%
0%
0%
167%
160%
31%
226%
106%
80%
0%
0%
180%
All nutrients comparison - raw data values
Nutrient
DV% diff.
Polyunsaturated fat
0.407g
15.558g
101%
Fats
1.23g
49.24g
74%
Folate
525µg
240µg
71%
Vitamin B3
1.174mg
12.066mg
68%
Monounsaturated fat
0.229g
24.426g
60%
Vitamin E
0.21mg
8.33mg
54%
Selenium
27.9µg
7.2µg
38%
Manganese
1.148mg
1.934mg
34%
Fiber
15.5g
8.5g
28%
Copper
0.893mg
1.144mg
28%
Saturated fat
0.235g
6.279g
27%
Potassium
1393mg
705mg
20%
Vitamin B5
0.785mg
1.767mg
20%
Carbs
62.55g
16.13g
15%
Starch
34.17g
14%
Calories
347kcal
567kcal
11%
Vitamin B6
0.474mg
0.348mg
10%
Protein
21.42g
25.8g
9%
Zinc
2.28mg
3.27mg
9%
Vitamin C
6.3mg
0mg
7%
Iron
5.07mg
4.58mg
6%
Vitamin B1
0.713mg
0.64mg
6%
Vitamin B2
0.212mg
0.135mg
6%
Phosphorus
411mg
376mg
5%
Vitamin K
5.6µg
0µg
5%
Magnesium
176mg
168mg
2%
Calcium
113mg
92mg
2%
Choline
66.2mg
52.5mg
2%
Protein per 100 calories
6.2g
4.6g
N/A
Calories per 10 g protein
162kcal
220kcal
N/A
Weight per 100 calories
29g
18g
N/A
Unsaturated / Saturated Fat ratio
2.7
6.4
N/A
Net carbs
47.05g
7.63g
N/A
Sugar
2.11g
4.72g
N/A
Sodium
12mg
18mg
0%
Tryptophan
0.237mg
0.25mg
0%
Threonine
0.81mg
0.883mg
0%
Isoleucine
0.871mg
0.907mg
0%
Leucine
1.558mg
1.672mg
0%
Lysine
1.356mg
0.926mg
0%
Methionine
0.259mg
0.317mg
0%
Phenylalanine
1.095mg
1.377mg
0%
Valine
0.998mg
1.082mg
0%
Histidine
0.556mg
0.652mg
0%
Macronutrient Comparison
Macronutrient breakdown side-by-side comparison
3
21%
63%
11%
3%
Protein:
21.42 g
Fats:
1.23 g
Carbs:
62.55 g
Water:
11.33 g
Other:
3.47 g
2
26%
49%
16%
7%
2%
Protein:
25.8 g
Fats:
49.24 g
Carbs:
16.13 g
Water:
6.5 g
Other:
2.33 g
Contains
more
Carbs Carbs
+287.8%
Contains
more
Water Water
+74.3%
Contains
more
Other Other
+48.9%
Contains
more
Protein Protein
+20.4%
Contains
more
Fats Fats
+3903.3%
Fat Type Comparison
Fat type breakdown side-by-side comparison
1
27%
26%
47%
Saturated fat:
Sat. Fat
0.235 g
Monounsaturated fat:
Mono. Fat
0.229 g
Polyunsaturated fat:
Poly. Fat
0.407 g
2
14%
53%
34%
Saturated fat:
Sat. Fat
6.279 g
Monounsaturated fat:
Mono. Fat
24.426 g
Polyunsaturated fat:
Poly. Fat
15.558 g
Contains
less
Sat. Fat Saturated fat
-96.3%
Contains
more
Mono. Fat Monounsaturated fat
+10566.4%
Contains
more
Poly. Fat Polyunsaturated fat
+3722.6%