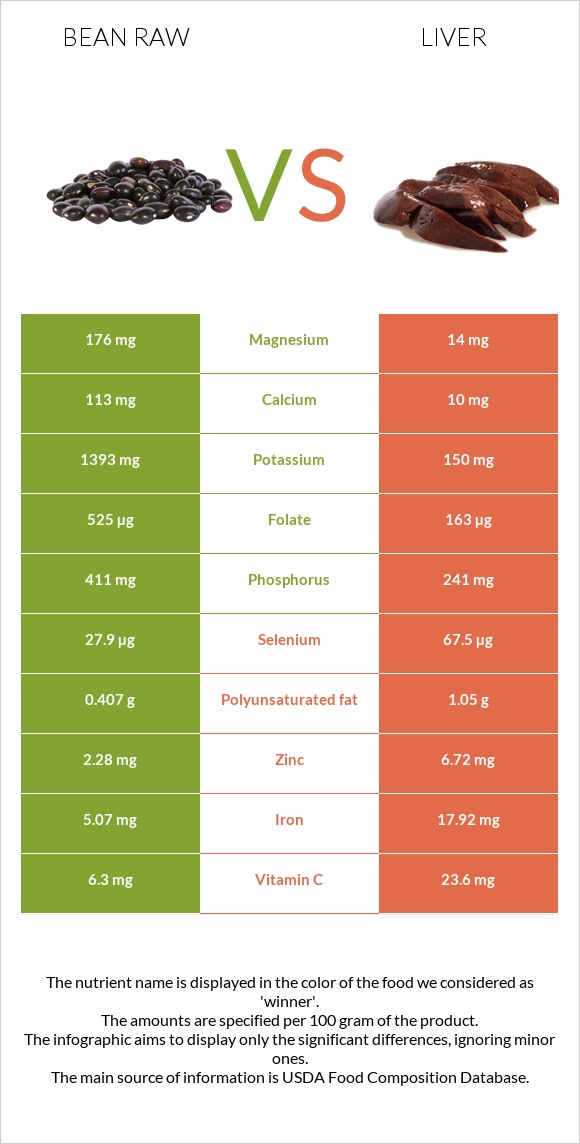
Summary of differences between bean raw and liver Bean raw has more folate and fiber, while liver has more vitamin B12, vitamin A, iron, vitamin B2, vitamin B5, selenium, and vitamin B3. Liver covers your daily need for vitamin B12, 778% more than bean raw. Liver has a lower glycemic index. The glycemic index of liver is 0, while the glycemic index of bean raw is 33. These are the specific foods used in this comparison Beans, pinto, mature seeds, raw and Pork, fresh, variety meats, and by-products, liver, cooked, braised .
Infographic
Mineral Comparison
Mineral comparison score is based on the number of minerals by which one or the other food is richer. The "coverage" charts below show how much of the daily needs can be covered by 300 grams of the food.
7
100 g
300 g
1 tbsp - 12g 1 cup - 193g
Magnesium
Magnesium
Calcium
Calcium
Potassium
Potassium
Iron
Iron
Copper
Copper
Zinc
Zinc
Phosphorus
Phosphorus
Sodium
Sodium
Manganese
Manganese
Selenium
Selenium
126%
34%
123%
190%
298%
62%
176%
1.6%
150%
152%
3
100 g
300 g
3 oz - 85g
Magnesium
Magnesium
Calcium
Calcium
Potassium
Potassium
Iron
Iron
Copper
Copper
Zinc
Zinc
Phosphorus
Phosphorus
Sodium
Sodium
Manganese
Manganese
Selenium
Selenium
10%
3%
13%
672%
211%
183%
103%
6.4%
39%
368%
Vitamin Comparison
Vitamin comparison score is based on the number of vitamins by which one or the other food is richer. The "coverage" charts below show how much of the daily needs can be covered by 300 grams of the food.
4
100 g
300 g
1 tbsp - 12g 1 cup - 193g
Vitamin C
Vit. C
Vitamin D
Vit. D
Vitamin A
Vit. A
Vitamin E
Vit. E
Vitamin B1
Vit. B1
Vitamin B2
Vit. B2
Vitamin B3
Vit. B3
Vitamin B5
Vit. B5
Vitamin B6
Vit. B6
Vitamin B12
Vit. B12
Vitamin K
Vit. K
Folate
Folate
21%
0%
0%
4.2%
178%
49%
22%
47%
109%
0%
14%
394%
7
100 g
300 g
3 oz - 85g
Vitamin C
Vit. C
Vitamin D
Vit. D
Vitamin A
Vit. A
Vitamin E
Vit. E
Vitamin B1
Vit. B1
Vitamin B2
Vit. B2
Vitamin B3
Vit. B3
Vitamin B5
Vit. B5
Vitamin B6
Vit. B6
Vitamin B12
Vit. B12
Vitamin K
Vit. K
Folate
Folate
79%
0%
1802%
0%
65%
507%
158%
286%
132%
2334%
0%
122%
All nutrients comparison - raw data values
Nutrient
DV% diff.
Vitamin B12
0µg
18.67µg
778%
Vitamin A
0µg
5405µg
601%
Iron
5.07mg
17.92mg
161%
Vitamin B2
0.212mg
2.196mg
153%
Cholesterol
0mg
355mg
118%
Folate
525µg
163µg
91%
Vitamin B5
0.785mg
4.774mg
80%
Selenium
27.9µg
67.5µg
72%
Fiber
15.5g
0g
62%
Vitamin B3
1.174mg
8.435mg
45%
Zinc
2.28mg
6.72mg
40%
Magnesium
176mg
14mg
39%
Vitamin B1
0.713mg
0.258mg
38%
Potassium
1393mg
150mg
37%
Manganese
1.148mg
0.3mg
37%
Copper
0.893mg
0.634mg
29%
Phosphorus
411mg
241mg
24%
Carbs
62.55g
3.76g
20%
Vitamin C
6.3mg
23.6mg
19%
Starch
34.17g
14%
Choline
66.2mg
12%
Calcium
113mg
10mg
10%
Calories
347kcal
165kcal
9%
Protein
21.42g
26.02g
9%
Vitamin B6
0.474mg
0.57mg
7%
Fats
1.23g
4.4g
5%
Vitamin K
5.6µg
5%
Saturated fat
0.235g
1.41g
5%
Polyunsaturated fat
0.407g
1.05g
4%
Sodium
12mg
49mg
2%
Vitamin E
0.21mg
1%
Monounsaturated fat
0.229g
0.63g
1%
Protein per 100 calories
6.2g
16g
N/A
Calories per 10 g protein
162kcal
63kcal
N/A
Weight per 100 calories
29g
61g
N/A
Unsaturated / Saturated Fat ratio
2.7
1.2
N/A
Net carbs
47.05g
3.76g
N/A
Sugar
2.11g
N/A
Tryptophan
0.237mg
0.366mg
0%
Threonine
0.81mg
1.107mg
0%
Isoleucine
0.871mg
1.32mg
0%
Leucine
1.558mg
2.319mg
0%
Lysine
1.356mg
2.007mg
0%
Methionine
0.259mg
0.645mg
0%
Phenylalanine
1.095mg
1.274mg
0%
Valine
0.998mg
1.607mg
0%
Histidine
0.556mg
0.708mg
0%
Omega-3 - DHA
0g
0.03g
N/A
Omega-3 - DPA
0g
0.04g
N/A
Macronutrient Comparison
Macronutrient breakdown side-by-side comparison
2
21%
63%
11%
3%
Protein:
21.42 g
Fats:
1.23 g
Carbs:
62.55 g
Water:
11.33 g
Other:
3.47 g
3
26%
4%
4%
64%
Protein:
26.02 g
Fats:
4.4 g
Carbs:
3.76 g
Water:
64.32 g
Other:
1.5 g
Contains
more
Carbs Carbs
+1563.6%
Contains
more
Other Other
+131.3%
Contains
more
Protein Protein
+21.5%
Contains
more
Fats Fats
+257.7%
Contains
more
Water Water
+467.7%
Fat Type Comparison
Fat type breakdown side-by-side comparison
1
27%
26%
47%
Saturated fat:
Sat. Fat
0.235 g
Monounsaturated fat:
Mono. Fat
0.229 g
Polyunsaturated fat:
Poly. Fat
0.407 g
2
46%
20%
34%
Saturated fat:
Sat. Fat
1.41 g
Monounsaturated fat:
Mono. Fat
0.63 g
Polyunsaturated fat:
Poly. Fat
1.05 g
Contains
less
Sat. Fat Saturated fat
-83.3%
Contains
more
Mono. Fat Monounsaturated fat
+175.1%
Contains
more
Poly. Fat Polyunsaturated fat
+158%