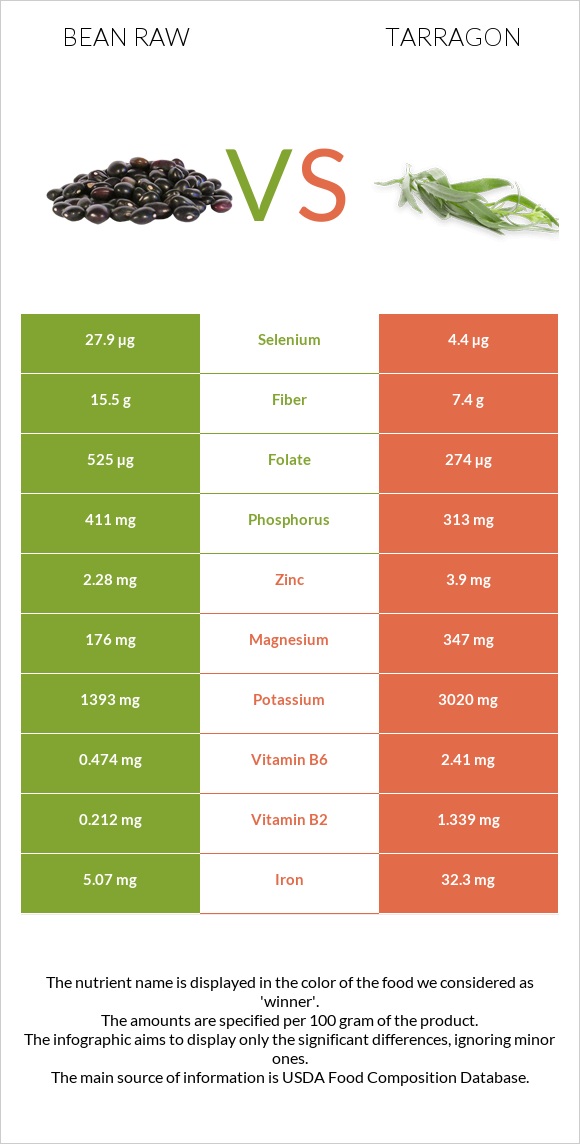
Summary of differences between bean raw and tarragon Bean raw has more folate, while tarragon has more iron, manganese, vitamin B6, calcium, vitamin B2, vitamin A, vitamin B3, vitamin C, and potassium. Tarragon covers your daily need for iron, 340% more than bean raw. Bean raw contains 2 times more folate than tarragon. While bean raw contains 525µg of folate, tarragon contains only 274µg. Tarragon has a lower glycemic index. The glycemic index of tarragon is 0, while the glycemic index of bean raw is 33. These are the specific foods used in this comparison Beans, pinto, mature seeds, raw and Spices, tarragon, dried .
Infographic
Mineral Comparison
Mineral comparison score is based on the number of minerals by which one or the other food is richer. The "coverage" charts below show how much of the daily needs can be covered by 300 grams of the food.
4
100 g
300 g
1 tbsp - 12g 1 cup - 193g
Magnesium
Magnesium
Calcium
Calcium
Potassium
Potassium
Iron
Iron
Copper
Copper
Zinc
Zinc
Phosphorus
Phosphorus
Sodium
Sodium
Manganese
Manganese
Selenium
Selenium
126%
34%
123%
190%
298%
62%
176%
1.6%
150%
152%
6
100 g
300 g
0.25 tsp - 0.5g 1 tsp, ground - 1.6g 1 tbsp, leaves - 1.8g 1 tbsp, ground - 4.8g
Magnesium
Magnesium
Calcium
Calcium
Potassium
Potassium
Iron
Iron
Copper
Copper
Zinc
Zinc
Phosphorus
Phosphorus
Sodium
Sodium
Manganese
Manganese
Selenium
Selenium
248%
342%
266%
1211%
226%
106%
134%
8.1%
1039%
24%
Vitamin Comparison
Vitamin comparison score is based on the number of vitamins by which one or the other food is richer. The "coverage" charts below show how much of the daily needs can be covered by 300 grams of the food.
5
100 g
300 g
1 tbsp - 12g 1 cup - 193g
Vitamin C
Vit. C
Vitamin D
Vit. D
Vitamin A
Vit. A
Vitamin E
Vit. E
Vitamin B1
Vit. B1
Vitamin B2
Vit. B2
Vitamin B3
Vit. B3
Vitamin B5
Vit. B5
Vitamin B6
Vit. B6
Vitamin B12
Vit. B12
Vitamin K
Vit. K
Folate
Folate
21%
0%
0%
4.2%
178%
49%
22%
47%
109%
0%
14%
394%
5
100 g
300 g
0.25 tsp - 0.5g 1 tsp, ground - 1.6g 1 tbsp, leaves - 1.8g 1 tbsp, ground - 4.8g
Vitamin C
Vit. C
Vitamin D
Vit. D
Vitamin A
Vit. A
Vitamin E
Vit. E
Vitamin B1
Vit. B1
Vitamin B2
Vit. B2
Vitamin B3
Vit. B3
Vitamin B5
Vit. B5
Vitamin B6
Vit. B6
Vitamin B12
Vit. B12
Vitamin K
Vit. K
Folate
Folate
167%
0%
70%
0%
63%
309%
168%
0%
556%
0%
0%
206%
All nutrients comparison - raw data values
Nutrient
DV% diff.
Iron
5.07mg
32.3mg
340%
Manganese
1.148mg
7.967mg
296%
Vitamin B6
0.474mg
2.41mg
149%
Calcium
113mg
1139mg
103%
Vitamin B2
0.212mg
1.339mg
87%
Folate
525µg
274µg
63%
Vitamin C
6.3mg
50mg
49%
Vitamin B3
1.174mg
8.95mg
49%
Potassium
1393mg
3020mg
48%
Selenium
27.9µg
4.4µg
43%
Magnesium
176mg
347mg
41%
Vitamin B1
0.713mg
0.251mg
39%
Fiber
15.5g
7.4g
32%
Copper
0.893mg
0.677mg
24%
Vitamin A
0µg
210µg
23%
Polyunsaturated fat
0.407g
3.698g
22%
Vitamin B5
0.785mg
16%
Zinc
2.28mg
3.9mg
15%
Starch
34.17g
14%
Phosphorus
411mg
313mg
14%
Choline
66.2mg
12%
Fats
1.23g
7.24g
9%
Saturated fat
0.235g
1.881g
7%
Vitamin K
5.6µg
5%
Carbs
62.55g
50.22g
4%
Calories
347kcal
295kcal
3%
Protein
21.42g
22.77g
3%
Sodium
12mg
62mg
2%
Vitamin E
0.21mg
1%
Monounsaturated fat
0.229g
0.474g
1%
Protein per 100 calories
6.2g
7.7g
N/A
Calories per 10 g protein
162kcal
130kcal
N/A
Weight per 100 calories
29g
34g
N/A
Unsaturated / Saturated Fat ratio
2.7
2.2
N/A
Net carbs
47.05g
42.82g
N/A
Sugar
2.11g
N/A
Tryptophan
0.237mg
0%
Threonine
0.81mg
0%
Isoleucine
0.871mg
0%
Leucine
1.558mg
0%
Lysine
1.356mg
0%
Methionine
0.259mg
0%
Phenylalanine
1.095mg
0%
Valine
0.998mg
0%
Histidine
0.556mg
0%
Macronutrient Comparison
Macronutrient breakdown side-by-side comparison
2
21%
63%
11%
3%
Protein:
21.42 g
Fats:
1.23 g
Carbs:
62.55 g
Water:
11.33 g
Other:
3.47 g
3
23%
7%
50%
8%
12%
Protein:
22.77 g
Fats:
7.24 g
Carbs:
50.22 g
Water:
7.74 g
Other:
12.03 g
Contains
more
Carbs Carbs
+24.6%
Contains
more
Water Water
+46.4%
Contains
more
Fats Fats
+488.6%
Contains
more
Other Other
+246.7%
~equal in
Protein
~22.77g
Fat Type Comparison
Fat type breakdown side-by-side comparison
1
27%
26%
47%
Saturated fat:
Sat. Fat
0.235 g
Monounsaturated fat:
Mono. Fat
0.229 g
Polyunsaturated fat:
Poly. Fat
0.407 g
2
31%
8%
61%
Saturated fat:
Sat. Fat
1.881 g
Monounsaturated fat:
Mono. Fat
0.474 g
Polyunsaturated fat:
Poly. Fat
3.698 g
Contains
less
Sat. Fat Saturated fat
-87.5%
Contains
more
Mono. Fat Monounsaturated fat
+107%
Contains
more
Poly. Fat Polyunsaturated fat
+808.6%