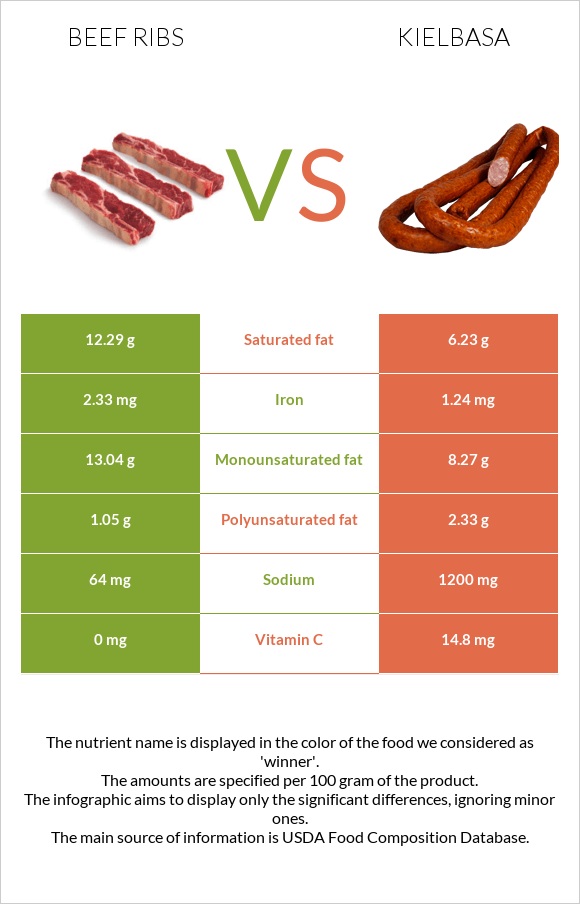
Significant differences between beef ribs and kielbasa Beef ribs have more iron and monounsaturated fat; however, kielbasa is richer in vitamin C and polyunsaturated fat. Kielbasa covers your daily sodium needs 49% more than beef ribs. Kielbasa has 2 times less saturated fat than beef ribs. Beef ribs have 12.29g of saturated fat, while kielbasa has 6.23g. Kielbasa has a higher glycemic index. The glycemic index of kielbasa is 28, while the glycemic index of beef ribs is 0. Specific food types used in this comparison are Beef, rib, large end (ribs 6-9), separable lean, and fat, trimmed to 0" fat, choice, cooked, roasted and Kielbasa, Polish, turkey, and beef, smoked .
Infographic
Mineral Comparison
Mineral comparison score is based on the number of minerals by which one or the other food is richer. The "coverage" charts below show how much of the daily needs can be covered by 300 grams of the food.
10
100 g
300 g
3 oz - 85g 1 piece, cooked, excluding refuse (yield from 1 lb raw meat with refuse) - 290g
Magnesium
Magnesium
Calcium
Calcium
Potassium
Potassium
Iron
Iron
Copper
Copper
Zinc
Zinc
Phosphorus
Phosphorus
Sodium
Sodium
Manganese
Manganese
Selenium
Selenium
14%
3%
26%
87%
29%
157%
74%
8.3%
1.7%
116%
0
100 g
300 g
1 serving 2 oz - 56g
Magnesium
Magnesium
Calcium
Calcium
Potassium
Potassium
Iron
Iron
Copper
Copper
Zinc
Zinc
Phosphorus
Phosphorus
Sodium
Sodium
Manganese
Manganese
Selenium
Selenium
0%
0%
0%
47%
0%
0%
0%
157%
0%
0%
Vitamin Comparison
Vitamin comparison score is based on the number of vitamins by which one or the other food is richer. The "coverage" charts below show how much of the daily needs can be covered by 300 grams of the food.
7
100 g
300 g
3 oz - 85g 1 piece, cooked, excluding refuse (yield from 1 lb raw meat with refuse) - 290g
Vitamin C
Vit. C
Vitamin D
Vit. D
Vitamin A
Vit. A
Vitamin E
Vit. E
Vitamin B1
Vit. B1
Vitamin B2
Vit. B2
Vitamin B3
Vit. B3
Vitamin B5
Vit. B5
Vitamin B6
Vit. B6
Vitamin B12
Vit. B12
Vitamin K
Vit. K
Folate
Folate
0%
0%
0%
0%
18%
44%
68%
22%
53%
291%
0%
5.3%
1
100 g
300 g
1 serving 2 oz - 56g
Vitamin C
Vit. C
Vitamin D
Vit. D
Vitamin A
Vit. A
Vitamin E
Vit. E
Vitamin B1
Vit. B1
Vitamin B2
Vit. B2
Vitamin B3
Vit. B3
Vitamin B5
Vit. B5
Vitamin B6
Vit. B6
Vitamin B12
Vit. B12
Vitamin K
Vit. K
Folate
Folate
49%
0%
0%
0%
0%
0%
0%
0%
0%
0%
0%
0%
All nutrients comparison - raw data values
Nutrient
DV% diff.
Vitamin B12
2.33µg
97%
Zinc
5.76mg
52%
Sodium
64mg
1200mg
49%
Selenium
21.2µg
39%
Saturated fat
12.29g
6.23g
28%
Phosphorus
172mg
25%
Vitamin B3
3.64mg
23%
Fats
30.49g
17.6g
20%
Protein
22.8g
13.1g
19%
Vitamin B6
0.23mg
18%
Vitamin C
0mg
14.8mg
16%
Vitamin B2
0.19mg
15%
Iron
2.33mg
1.24mg
14%
Monounsaturated fat
13.04g
8.27g
12%
Copper
0.088mg
10%
Potassium
290mg
9%
Polyunsaturated fat
1.05g
2.33g
9%
Calories
372kcal
226kcal
7%
Vitamin B5
0.37mg
7%
Vitamin B1
0.07mg
6%
Cholesterol
85mg
70mg
5%
Magnesium
20mg
5%
Folate
7µg
2%
Carbs
0g
3.9g
1%
Calcium
10mg
1%
Manganese
0.013mg
1%
Protein per 100 calories
6.1g
5.8g
N/A
Calories per 10 g protein
163kcal
173kcal
N/A
Weight per 100 calories
27g
44g
N/A
Unsaturated / Saturated Fat ratio
1.1
1.7
N/A
Net carbs
0g
3.9g
N/A
Tryptophan
0.255mg
0%
Threonine
0.996mg
0%
Isoleucine
1.025mg
0%
Leucine
1.802mg
0%
Lysine
1.897mg
0%
Methionine
0.584mg
0%
Phenylalanine
0.89mg
0%
Valine
1.109mg
0%
Histidine
0.781mg
0%
Macronutrient Comparison
Macronutrient breakdown side-by-side comparison
2
23%
30%
46%
Protein:
22.8 g
Fats:
30.49 g
Carbs:
0 g
Water:
46.1 g
Other:
0.61 g
3
13%
18%
4%
62%
3%
Protein:
13.1 g
Fats:
17.6 g
Carbs:
3.9 g
Water:
62 g
Other:
3.4 g
Contains
more
Protein Protein
+74%
Contains
more
Fats Fats
+73.2%
Contains
more
Carbs Carbs
+∞%
Contains
more
Water Water
+34.5%
Contains
more
Other Other
+457.4%
Fat Type Comparison
Fat type breakdown side-by-side comparison
1
47%
49%
4%
Saturated fat:
Sat. Fat
12.29 g
Monounsaturated fat:
Mono. Fat
13.04 g
Polyunsaturated fat:
Poly. Fat
1.05 g
2
37%
49%
14%
Saturated fat:
Sat. Fat
6.23 g
Monounsaturated fat:
Mono. Fat
8.27 g
Polyunsaturated fat:
Poly. Fat
2.33 g
Contains
more
Mono. Fat Monounsaturated fat
+57.7%
Contains
less
Sat. Fat Saturated fat
-49.3%
Contains
more
Poly. Fat Polyunsaturated fat
+121.9%