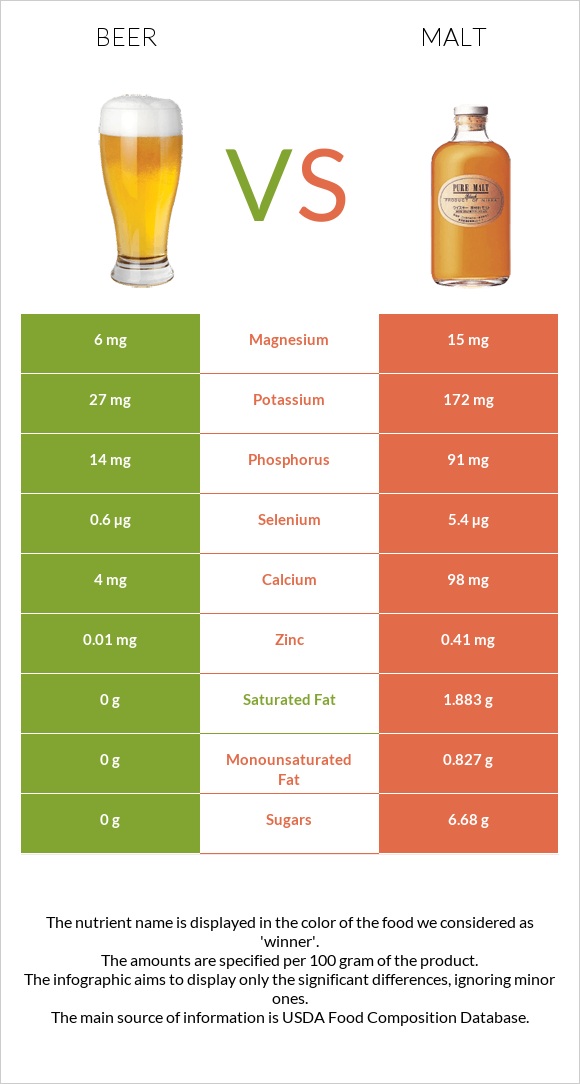
Differences between beer and malt Beer contains less vitamin B12, vitamin B2, phosphorus, calcium, selenium, and vitamin B5 than malt. Malt's daily need coverage for vitamin B12 is 17% higher. Malt has a lower glycemic index. The glycemic index of malt is 59, while the glycemic index of beer is 104. The food types used in this comparison are Alcoholic beverage, beer, regular, all and Beverages, Malted drink mix, chocolate, powder, prepared with whole milk .
Infographic
Mineral Comparison
Mineral comparison score is based on the number of minerals by which one or the other food is richer. The "coverage" charts below show how much of the daily needs can be covered by 300 grams of the food.
1
100 g
300 g
1 fl oz - 29.7g 1 can - 356g
Magnesium
Magnesium
Calcium
Calcium
Potassium
Potassium
Iron
Iron
Copper
Copper
Zinc
Zinc
Phosphorus
Phosphorus
Sodium
Sodium
Manganese
Manganese
Selenium
Selenium
4.3%
1.2%
2.4%
0.75%
1.7%
0.27%
6%
0.52%
1%
3.3%
9
100 g
300 g
1 cup (8 fl oz) - 265g
Magnesium
Magnesium
Calcium
Calcium
Potassium
Potassium
Iron
Iron
Copper
Copper
Zinc
Zinc
Phosphorus
Phosphorus
Sodium
Sodium
Manganese
Manganese
Selenium
Selenium
11%
29%
15%
7.9%
12%
11%
39%
7.8%
10%
29%
Vitamin Comparison
Vitamin comparison score is based on the number of vitamins by which one or the other food is richer. The "coverage" charts below show how much of the daily needs can be covered by 300 grams of the food.
1
100 g
300 g
1 fl oz - 29.7g 1 can - 356g
Vitamin C
Vit. C
Vitamin D
Vit. D
Vitamin A
Vit. A
Vitamin E
Vit. E
Vitamin B1
Vit. B1
Vitamin B2
Vit. B2
Vitamin B3
Vit. B3
Vitamin B5
Vit. B5
Vitamin B6
Vit. B6
Vitamin B12
Vit. B12
Vitamin K
Vit. K
Folate
Folate
0%
0%
0%
0%
1.3%
5.8%
9.6%
2.5%
11%
2.5%
0%
4.5%
9
100 g
300 g
1 cup (8 fl oz) - 265g
Vitamin C
Vit. C
Vitamin D
Vit. D
Vitamin A
Vit. A
Vitamin E
Vit. E
Vitamin B1
Vit. B1
Vitamin B2
Vit. B2
Vitamin B3
Vit. B3
Vitamin B5
Vit. B5
Vitamin B6
Vit. B6
Vitamin B12
Vit. B12
Vitamin K
Vit. K
Folate
Folate
0.33%
0%
8.7%
1.2%
14%
42%
4.9%
21%
11%
53%
0.75%
6.8%
All nutrients comparison - raw data values
Nutrient
DV% diff.
Vitamin B12
0.02µg
0.42µg
17%
Vitamin B2
0.025mg
0.184mg
12%
Phosphorus
14mg
91mg
11%
Calcium
4mg
98mg
9%
Selenium
0.6µg
5.4µg
9%
Saturated fat
0g
1.883g
9%
Protein
0.46g
3.37g
6%
Vitamin B5
0.041mg
0.354mg
6%
Fats
0g
3.29g
5%
Potassium
27mg
172mg
4%
Copper
0.005mg
0.037mg
4%
Zinc
0.01mg
0.41mg
4%
Vitamin B1
0.005mg
0.054mg
4%
Carbs
3.55g
11.2g
3%
Cholesterol
0mg
10mg
3%
Vitamin A
0µg
26µg
3%
Manganese
0.008mg
0.08mg
3%
Calories
43kcal
85kcal
2%
Magnesium
6mg
15mg
2%
Iron
0.02mg
0.21mg
2%
Fiber
0g
0.5g
2%
Sodium
4mg
60mg
2%
Vitamin B3
0.513mg
0.259mg
2%
Choline
10.1mg
2%
Monounsaturated fat
0g
0.827g
2%
Folate
6µg
9µg
1%
Polyunsaturated fat
0g
0.208g
1%
Caffeine
0mg
3mg
1%
Protein per 100 calories
1.1g
4g
N/A
Calories per 10 g protein
935kcal
252kcal
N/A
Weight per 100 calories
233g
118g
N/A
Unsaturated / Saturated Fat ratio
0.55
N/A
Vitamin C
0mg
0.1mg
0%
Net carbs
3.55g
10.7g
N/A
Sugar
0g
6.68g
N/A
Vitamin E
0mg
0.06mg
0%
Vitamin B6
0.046mg
0.046mg
0%
Vitamin K
0µg
0.3µg
0%
Tryptophan
0mg
0.074mg
0%
Threonine
0mg
0.143mg
0%
Isoleucine
0mg
0.165mg
0%
Leucine
0mg
0.268mg
0%
Lysine
0mg
0.142mg
0%
Methionine
0mg
0.074mg
0%
Phenylalanine
0mg
0.15mg
0%
Valine
0mg
0.193mg
0%
Histidine
0mg
0.077mg
0%
Macronutrient Comparison
Macronutrient breakdown side-by-side comparison
2
4%
92%
4%
Protein:
0.46 g
Fats:
0 g
Carbs:
3.55 g
Water:
91.96 g
Other:
4.03 g
3
3%
3%
11%
81%
Protein:
3.37 g
Fats:
3.29 g
Carbs:
11.2 g
Water:
81.34 g
Other:
0.8 g
Contains
more
Water Water
+13.1%
Contains
more
Other Other
+403.8%
Contains
more
Protein Protein
+632.6%
Contains
more
Fats Fats
+∞%
Contains
more
Carbs Carbs
+215.5%