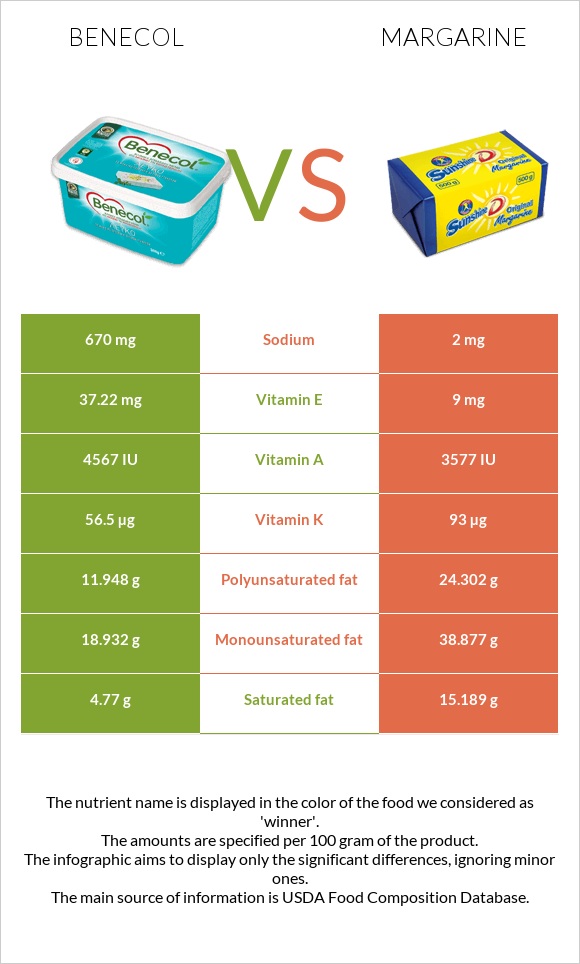
The main differences between benecol and margarine Benecol is richer in vitamin E and vitamin A, yet margarine is richer in vitamin K, monounsaturated fat, and polyunsaturated fat. Daily need coverage for vitamin E for benecol is 188% higher. Benecol contains 335 times more sodium than margarine. Benecol contains 670mg of sodium, while margarine contains 2mg. Food types used in this article are Margarine-like spread, BENECOL Light Spread and Margarine, regular, 80% fat, composite, stick, without salt .
Infographic
Mineral Comparison
Mineral comparison score is based on the number of minerals by which one or the other food is richer. The "coverage" charts below show how much of the daily needs can be covered by 300 grams of the food.
1
100 g
300 g
1 tablespoon (1 NLEA serving) - 14g
Magnesium
Magnesium
Calcium
Calcium
Potassium
Potassium
Iron
Iron
Copper
Copper
Zinc
Zinc
Phosphorus
Phosphorus
Sodium
Sodium
Manganese
Manganese
Selenium
Selenium
0.71%
1.2%
0.35%
0%
0%
0%
1.7%
87%
0%
0%
5
100 g
300 g
1 pat (1" sq, 1/3" high) - 5g 1 tbsp - 14.2g 1 stick - 113g 1 cup - 227g
Magnesium
Magnesium
Calcium
Calcium
Potassium
Potassium
Iron
Iron
Copper
Copper
Zinc
Zinc
Phosphorus
Phosphorus
Sodium
Sodium
Manganese
Manganese
Selenium
Selenium
2.1%
0.9%
1.6%
2.3%
0%
0%
2.1%
0.26%
0%
0%
Vitamin Comparison
Vitamin comparison score is based on the number of vitamins by which one or the other food is richer. The "coverage" charts below show how much of the daily needs can be covered by 300 grams of the food.
3
100 g
300 g
1 tablespoon (1 NLEA serving) - 14g
Vitamin C
Vit. C
Vitamin D
Vit. D
Vitamin A
Vit. A
Vitamin E
Vit. E
Vitamin B1
Vit. B1
Vitamin B2
Vit. B2
Vitamin B3
Vit. B3
Vitamin B5
Vit. B5
Vitamin B6
Vit. B6
Vitamin B12
Vit. B12
Vitamin K
Vit. K
Folate
Folate
0%
0%
457%
744%
3%
0%
0%
0%
0%
0%
141%
0%
7
100 g
300 g
1 pat (1" sq, 1/3" high) - 5g 1 tbsp - 14.2g 1 stick - 113g 1 cup - 227g
Vitamin C
Vit. C
Vitamin D
Vit. D
Vitamin A
Vit. A
Vitamin E
Vit. E
Vitamin B1
Vit. B1
Vitamin B2
Vit. B2
Vitamin B3
Vit. B3
Vitamin B5
Vit. B5
Vitamin B6
Vit. B6
Vitamin B12
Vit. B12
Vitamin K
Vit. K
Folate
Folate
0.67%
0%
273%
180%
2.5%
8.5%
0.43%
0%
2.1%
13%
233%
0.75%
All nutrients comparison - raw data values
Nutrient
DV% diff.
Vitamin E
37.22mg
9mg
188%
Polyunsaturated fat
11.948g
24.302g
82%
Fats
38.71g
80.71g
65%
Vitamin A
1370µg
819µg
61%
Monounsaturated fat
18.932g
38.877g
50%
Saturated fat
4.77g
15.189g
47%
Vitamin K
56.5µg
93µg
30%
Sodium
670mg
2mg
29%
Calories
357kcal
717kcal
18%
Vitamin B12
0.1µg
4%
Vitamin B2
0mg
0.037mg
3%
Carbs
5.71g
0.7g
2%
Choline
12.4mg
2%
Iron
0mg
0.06mg
1%
Vitamin B6
0mg
0.009mg
1%
Protein
0g
0.16g
0%
Weight per 100 calories
28g
14g
N/A
Unsaturated / Saturated Fat ratio
6.5
4.2
N/A
Vitamin C
0.2mg
0%
Net carbs
5.71g
0.7g
N/A
Magnesium
1mg
3mg
0%
Calcium
4mg
3mg
0%
Potassium
4mg
18mg
0%
Phosphorus
4mg
5mg
0%
Vitamin B1
0.012mg
0.01mg
0%
Vitamin B3
0mg
0.023mg
0%
Folate
1µg
0%
Trans fat
2.214g
14.89g
N/A
Omega-3 - ALA
1.976g
N/A
Omega-3 - DPA
0g
0.006g
N/A
Omega-6 - Eicosadienoic acid
0.037g
N/A
Omega-6 - Linoleic acid
9.557g
21.522g
N/A
Macronutrient Comparison
Macronutrient breakdown side-by-side comparison
2
39%
6%
54%
2%
Protein:
0 g
Fats:
38.71 g
Carbs:
5.71 g
Water:
53.73 g
Other:
1.85 g
3
81%
17%
2%
Protein:
0.16 g
Fats:
80.71 g
Carbs:
0.7 g
Water:
16.52 g
Other:
1.91 g
Contains
more
Carbs Carbs
+715.7%
Contains
more
Water Water
+225.2%
Contains
more
Protein Protein
+∞%
Contains
more
Fats Fats
+108.5%
Fat Type Comparison
Fat type breakdown side-by-side comparison
1
13%
53%
34%
Saturated fat:
Sat. Fat
4.77 g
Monounsaturated fat:
Mono. Fat
18.932 g
Polyunsaturated fat:
Poly. Fat
11.948 g
2
19%
50%
31%
Saturated fat:
Sat. Fat
15.189 g
Monounsaturated fat:
Mono. Fat
38.877 g
Polyunsaturated fat:
Poly. Fat
24.302 g
Contains
less
Sat. Fat Saturated fat
-68.6%
Contains
more
Mono. Fat Monounsaturated fat
+105.4%
Contains
more
Poly. Fat Polyunsaturated fat
+103.4%