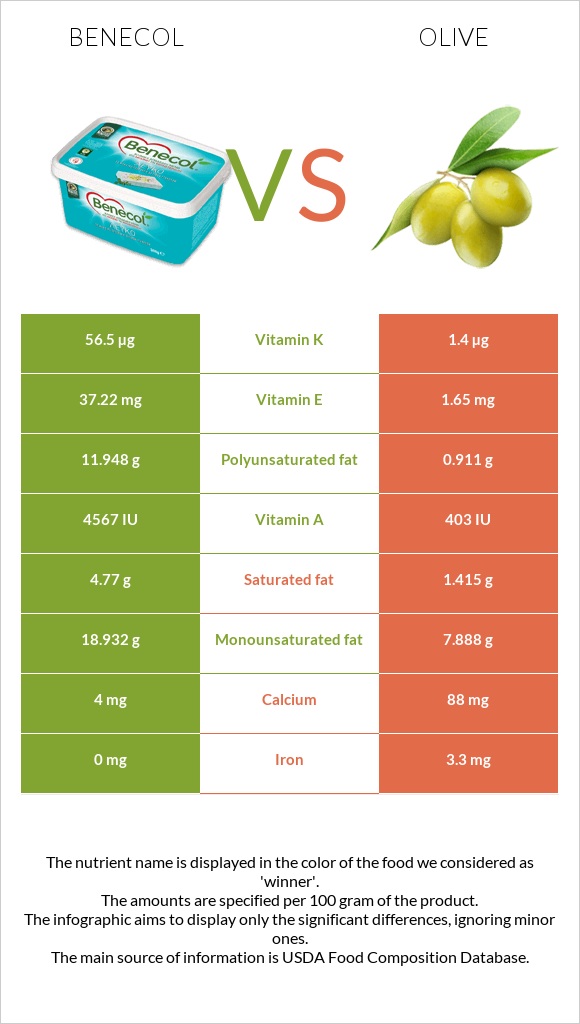
Significant differences between benecol and olive Benecol has more vitamin E, vitamin A, vitamin K, monounsaturated fat, and polyunsaturated fat; however, olive is richer in iron, copper, and calcium. Benecol covers your daily vitamin E needs 237% more than olive. Olive has 40 times less vitamin K than benecol. Benecol has 56.5µg of vitamin K, while olive has 1.4µg. Olive contains less saturated fat. Specific food types used in this comparison are Margarine-like spread, BENECOL Light Spread and Olives, ripe, canned (small-extra large) .
Infographic
Mineral Comparison
Mineral comparison score is based on the number of minerals by which one or the other food is richer. The "coverage" charts below show how much of the daily needs can be covered by 300 grams of the food.
1
100 g
300 g
1 tablespoon (1 NLEA serving) - 14g
Magnesium
Magnesium
Calcium
Calcium
Potassium
Potassium
Iron
Iron
Copper
Copper
Zinc
Zinc
Phosphorus
Phosphorus
Sodium
Sodium
Manganese
Manganese
Selenium
Selenium
0.71%
1.2%
0.35%
0%
0%
0%
1.7%
87%
0%
0%
8
100 g
300 g
1 small - 3.2g 1 large - 4.4g 1 tbsp - 8.4g
Magnesium
Magnesium
Calcium
Calcium
Potassium
Potassium
Iron
Iron
Copper
Copper
Zinc
Zinc
Phosphorus
Phosphorus
Sodium
Sodium
Manganese
Manganese
Selenium
Selenium
2.9%
26%
0.71%
124%
84%
6%
1.3%
96%
2.6%
4.9%
Vitamin Comparison
Vitamin comparison score is based on the number of vitamins by which one or the other food is richer. The "coverage" charts below show how much of the daily needs can be covered by 300 grams of the food.
4
100 g
300 g
1 tablespoon (1 NLEA serving) - 14g
Vitamin C
Vit. C
Vitamin D
Vit. D
Vitamin A
Vit. A
Vitamin E
Vit. E
Vitamin B1
Vit. B1
Vitamin B2
Vit. B2
Vitamin B3
Vit. B3
Vitamin B5
Vit. B5
Vitamin B6
Vit. B6
Vitamin B12
Vit. B12
Vitamin K
Vit. K
Folate
Folate
0%
0%
457%
744%
3%
0%
0%
0%
0%
0%
141%
0%
4
100 g
300 g
1 small - 3.2g 1 large - 4.4g 1 tbsp - 8.4g
Vitamin C
Vit. C
Vitamin D
Vit. D
Vitamin A
Vit. A
Vitamin E
Vit. E
Vitamin B1
Vit. B1
Vitamin B2
Vit. B2
Vitamin B3
Vit. B3
Vitamin B5
Vit. B5
Vitamin B6
Vit. B6
Vitamin B12
Vit. B12
Vitamin K
Vit. K
Folate
Folate
3%
0%
6.7%
33%
0.75%
0%
0.69%
0.9%
2.1%
0%
3.5%
0%
All nutrients comparison - raw data values
Nutrient
DV% diff.
Vitamin E
37.22mg
1.65mg
237%
Vitamin A
1370µg
20µg
150%
Polyunsaturated fat
11.948g
0.911g
74%
Vitamin K
56.5µg
1.4µg
46%
Fats
38.71g
10.68g
43%
Iron
0mg
3.3mg
41%
Copper
0mg
0.251mg
28%
Monounsaturated fat
18.932g
7.888g
28%
Saturated fat
4.77g
1.415g
15%
Fiber
3.2g
13%
Calories
357kcal
115kcal
12%
Calcium
4mg
88mg
8%
Sodium
670mg
735mg
3%
Protein
0g
0.84g
2%
Zinc
0mg
0.22mg
2%
Selenium
0.9µg
2%
Choline
10.3mg
2%
Vitamin C
0.9mg
1%
Magnesium
1mg
4mg
1%
Manganese
0mg
0.02mg
1%
Vitamin B1
0.012mg
0.003mg
1%
Vitamin B6
0mg
0.009mg
1%
Weight per 100 calories
28g
87g
N/A
Unsaturated / Saturated Fat ratio
6.5
6.2
N/A
Net carbs
5.71g
3.06g
N/A
Carbs
5.71g
6.26g
0%
Potassium
4mg
8mg
0%
Phosphorus
4mg
3mg
0%
Vitamin B3
0mg
0.037mg
0%
Vitamin B5
0.015mg
0%
Trans fat
2.214g
0g
N/A
Threonine
0.026mg
0%
Isoleucine
0.031mg
0%
Leucine
0.05mg
0%
Lysine
0.032mg
0%
Methionine
0.012mg
0%
Phenylalanine
0.029mg
0%
Valine
0.038mg
0%
Histidine
0.023mg
0%
Omega-3 - ALA
1.976g
N/A
Omega-6 - Eicosadienoic acid
0.037g
N/A
Omega-6 - Linoleic acid
9.557g
N/A
Macronutrient Comparison
Macronutrient breakdown side-by-side comparison
1
39%
6%
54%
2%
Protein:
0 g
Fats:
38.71 g
Carbs:
5.71 g
Water:
53.73 g
Other:
1.85 g
4
11%
6%
80%
2%
Protein:
0.84 g
Fats:
10.68 g
Carbs:
6.26 g
Water:
79.99 g
Other:
2.23 g
Contains
more
Fats Fats
+262.5%
Contains
more
Protein Protein
+∞%
Contains
more
Water Water
+48.9%
Contains
more
Other Other
+20.5%
Fat Type Comparison
Fat type breakdown side-by-side comparison
2
13%
53%
34%
Saturated fat:
Sat. Fat
4.77 g
Monounsaturated fat:
Mono. Fat
18.932 g
Polyunsaturated fat:
Poly. Fat
11.948 g
1
14%
77%
9%
Saturated fat:
Sat. Fat
1.415 g
Monounsaturated fat:
Mono. Fat
7.888 g
Polyunsaturated fat:
Poly. Fat
0.911 g
Contains
more
Mono. Fat Monounsaturated fat
+140%
Contains
more
Poly. Fat Polyunsaturated fat
+1211.5%
Contains
less
Sat. Fat Saturated fat
-70.3%