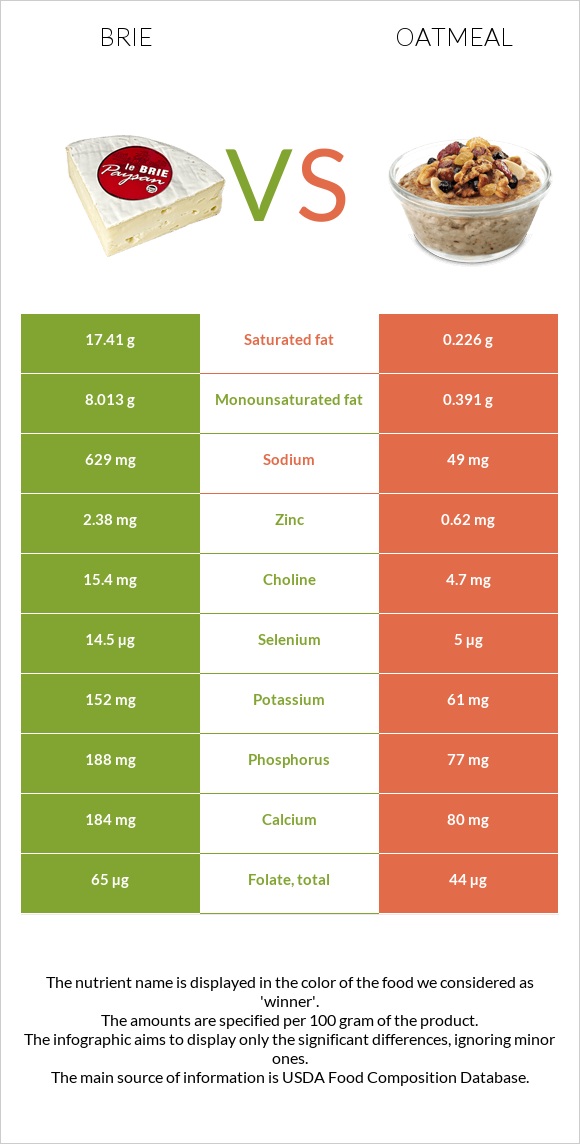
How are brie and oatmeal different? Brie is higher in vitamin B12, vitamin B2, selenium, and zinc; however, oatmeal is richer in iron, manganese, and vitamin B3. Daily need coverage for saturated fat for brie is 86% higher. Oatmeal has less cholesterol. Brie has a lower glycemic index (0) than oatmeal (79). Cheese, brie and Cereals, oats, instant, fortified, plain, prepared with water (boiling water added or microwaved) are the varieties used in this article.
Infographic
Mineral Comparison
Mineral comparison score is based on the number of minerals by which one or the other food is richer. The "coverage" charts below show how much of the daily needs can be covered by 300 grams of the food.
5
100 g
300 g
1 cubic inch - 17g 1 oz - 28.35g 1 package (4.5 oz) - 128g 1 cup, sliced - 144g 1 cup, melted - 240g
Magnesium
Magnesium
Calcium
Calcium
Potassium
Potassium
Iron
Iron
Copper
Copper
Zinc
Zinc
Phosphorus
Phosphorus
Sodium
Sodium
Manganese
Manganese
Selenium
Selenium
14%
55%
13%
19%
6.3%
65%
81%
82%
4.4%
79%
5
100 g
300 g
1 oz, dry, yields - 177g 1 packet, dry, yields - 177g 1 cup, cooked - 234g 1 cup, dry, yields - 501g
Magnesium
Magnesium
Calcium
Calcium
Potassium
Potassium
Iron
Iron
Copper
Copper
Zinc
Zinc
Phosphorus
Phosphorus
Sodium
Sodium
Manganese
Manganese
Selenium
Selenium
19%
24%
5.4%
224%
22%
17%
33%
6.4%
73%
27%
Vitamin Comparison
Vitamin comparison score is based on the number of vitamins by which one or the other food is richer. The "coverage" charts below show how much of the daily needs can be covered by 300 grams of the food.
8
100 g
300 g
1 cubic inch - 17g 1 oz - 28.35g 1 package (4.5 oz) - 128g 1 cup, sliced - 144g 1 cup, melted - 240g
Vitamin C
Vit. C
Vitamin D
Vit. D
Vitamin A
Vit. A
Vitamin E
Vit. E
Vitamin B1
Vit. B1
Vitamin B2
Vit. B2
Vitamin B3
Vit. B3
Vitamin B5
Vit. B5
Vitamin B6
Vit. B6
Vitamin B12
Vit. B12
Vitamin K
Vit. K
Folate
Folate
0%
7.5%
58%
4.8%
18%
120%
7.1%
41%
54%
206%
5.8%
49%
3
100 g
300 g
1 oz, dry, yields - 177g 1 packet, dry, yields - 177g 1 cup, cooked - 234g 1 cup, dry, yields - 501g
Vitamin C
Vit. C
Vitamin D
Vit. D
Vitamin A
Vit. A
Vitamin E
Vit. E
Vitamin B1
Vit. B1
Vitamin B2
Vit. B2
Vitamin B3
Vit. B3
Vitamin B5
Vit. B5
Vitamin B6
Vit. B6
Vitamin B12
Vit. B12
Vitamin K
Vit. K
Folate
Folate
0%
0%
43%
1.4%
65%
50%
57%
19%
67%
0%
1%
33%
All nutrients comparison - raw data values
Nutrient
DV% diff.
Saturated fat
17.41g
0.226g
78%
Vitamin B12
1.65µg
0µg
69%
Iron
0.5mg
5.96mg
68%
Fats
27.68g
1.36g
40%
Protein
20.75g
2.37g
37%
Cholesterol
100mg
0mg
33%
Sodium
629mg
49mg
25%
Manganese
0.034mg
0.558mg
23%
Vitamin B2
0.52mg
0.215mg
23%
Monounsaturated fat
8.013g
0.391g
19%
Selenium
14.5µg
5µg
17%
Vitamin B3
0.38mg
3.025mg
17%
Zinc
2.38mg
0.62mg
16%
Phosphorus
188mg
77mg
16%
Vitamin B1
0.07mg
0.26mg
16%
Calories
334kcal
68kcal
13%
Calcium
184mg
80mg
10%
Fiber
0g
1.7g
7%
Vitamin B5
0.69mg
0.317mg
7%
Copper
0.019mg
0.066mg
5%
Vitamin A
174µg
130µg
5%
Folate
65µg
44µg
5%
Carbs
0.45g
11.67g
4%
Starch
10.37g
4%
Vitamin B6
0.235mg
0.29mg
4%
Vitamin D*
20 IU
0 IU
3%
Vitamin D
0.5µg
0µg
3%
Potassium
152mg
61mg
3%
Polyunsaturated fat
0.826g
0.426g
3%
Vitamin K
2.3µg
0.4µg
2%
Choline
15.4mg
4.7mg
2%
Magnesium
20mg
26mg
1%
Vitamin E
0.24mg
0.07mg
1%
Protein per 100 calories
6.2g
3.5g
N/A
Calories per 10 g protein
161kcal
287kcal
N/A
Weight per 100 calories
30g
147g
N/A
Unsaturated / Saturated Fat ratio
0.51
3.6
N/A
Net carbs
0.45g
9.97g
N/A
Sugar
0.45g
0.46g
N/A
Trans fat
0.003g
N/A
Tryptophan
0.322mg
0.04mg
0%
Threonine
0.751mg
0.083mg
0%
Isoleucine
1.015mg
0.105mg
0%
Leucine
1.929mg
0.2mg
0%
Lysine
1.851mg
0.135mg
0%
Methionine
0.592mg
0.04mg
0%
Phenylalanine
1.158mg
0.13mg
0%
Valine
1.34mg
0.151mg
0%
Histidine
0.716mg
0.057mg
0%
Macronutrient Comparison
Macronutrient breakdown side-by-side comparison
3
21%
28%
48%
3%
Protein:
20.75 g
Fats:
27.68 g
Carbs:
0.45 g
Water:
48.42 g
Other:
2.7 g
2
2%
12%
84%
Protein:
2.37 g
Fats:
1.36 g
Carbs:
11.67 g
Water:
84.03 g
Other:
0.57 g
Contains
more
Protein Protein
+775.5%
Contains
more
Fats Fats
+1935.3%
Contains
more
Other Other
+373.7%
Contains
more
Carbs Carbs
+2493.3%
Contains
more
Water Water
+73.5%
Fat Type Comparison
Fat type breakdown side-by-side comparison
2
66%
31%
3%
Saturated fat:
Sat. Fat
17.41 g
Monounsaturated fat:
Mono. Fat
8.013 g
Polyunsaturated fat:
Poly. Fat
0.826 g
1
22%
37%
41%
Saturated fat:
Sat. Fat
0.226 g
Monounsaturated fat:
Mono. Fat
0.391 g
Polyunsaturated fat:
Poly. Fat
0.426 g
Contains
more
Mono. Fat Monounsaturated fat
+1949.4%
Contains
more
Poly. Fat Polyunsaturated fat
+93.9%
Contains
less
Sat. Fat Saturated fat
-98.7%