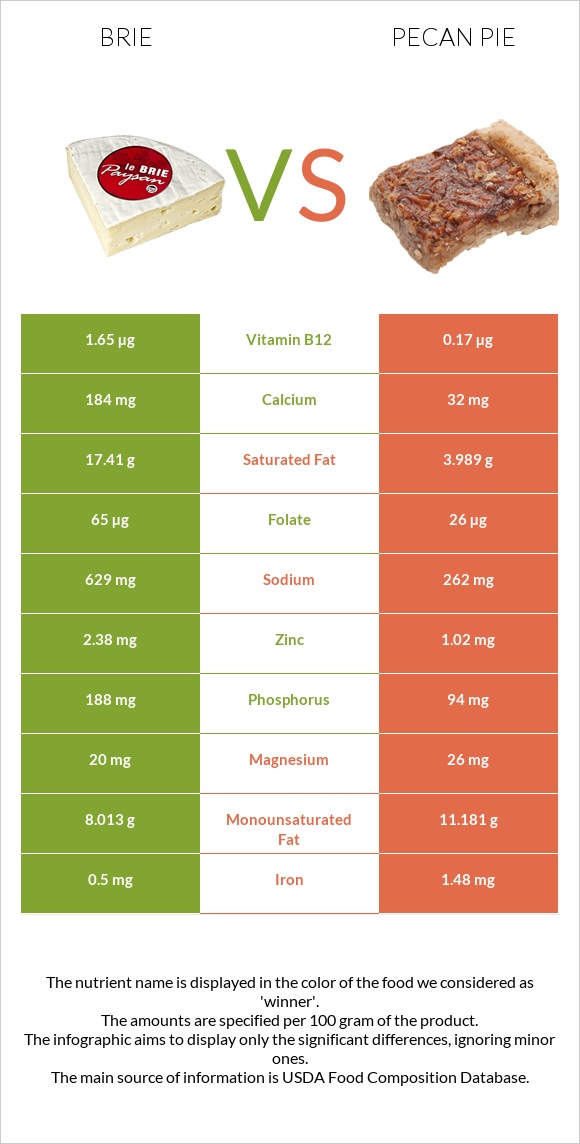
Differences between brie and pecan pie Brie has more vitamin B12, vitamin B2, calcium, vitamin B6, phosphorus, and zinc, while pecan pie has more manganese and copper. Brie's daily need coverage for saturated fat is 67% higher. Pecan pie contains 10 times less vitamin B12 than brie. Brie contains 1.65µg of vitamin B12, while pecan pie contains 0.17µg. The amount of saturated fat in pecan pie is lower. Brie has a lower glycemic index. The glycemic index of brie is 0, while the glycemic index of pecan pie is 59. The food types used in this comparison are Cheese, brie and Pie, pecan, prepared from recipe .
Infographic
Mineral Comparison
Mineral comparison score is based on the number of minerals by which one or the other food is richer. The "coverage" charts below show how much of the daily needs can be covered by 300 grams of the food.
5
100 g
300 g
1 cubic inch - 17g 1 oz - 28.35g 1 package (4.5 oz) - 128g 1 cup, sliced - 144g 1 cup, melted - 240g
Magnesium
Magnesium
Calcium
Calcium
Potassium
Potassium
Iron
Iron
Copper
Copper
Zinc
Zinc
Phosphorus
Phosphorus
Sodium
Sodium
Manganese
Manganese
Selenium
Selenium
14%
55%
13%
19%
6.3%
65%
81%
82%
4.4%
79%
5
100 g
300 g
1 oz - 28.35g 1 piece (1/8 of 9" dia) - 122g
Magnesium
Magnesium
Calcium
Calcium
Potassium
Potassium
Iron
Iron
Copper
Copper
Zinc
Zinc
Phosphorus
Phosphorus
Sodium
Sodium
Manganese
Manganese
Selenium
Selenium
19%
9.6%
12%
56%
70%
28%
40%
34%
93%
65%
Vitamin Comparison
Vitamin comparison score is based on the number of vitamins by which one or the other food is richer. The "coverage" charts below show how much of the daily needs can be covered by 300 grams of the food.
9
100 g
300 g
1 cubic inch - 17g 1 oz - 28.35g 1 package (4.5 oz) - 128g 1 cup, sliced - 144g 1 cup, melted - 240g
Vitamin C
Vit. C
Vitamin D
Vit. D
Vitamin A
Vit. A
Vitamin E
Vit. E
Vitamin B1
Vit. B1
Vitamin B2
Vit. B2
Vitamin B3
Vit. B3
Vitamin B5
Vit. B5
Vitamin B6
Vit. B6
Vitamin B12
Vit. B12
Vitamin K
Vit. K
Folate
Folate
0%
7.5%
58%
4.8%
18%
120%
7.1%
41%
54%
206%
5.8%
49%
3
100 g
300 g
1 oz - 28.35g 1 piece (1/8 of 9" dia) - 122g
Vitamin C
Vit. C
Vitamin D
Vit. D
Vitamin A
Vit. A
Vitamin E
Vit. E
Vitamin B1
Vit. B1
Vitamin B2
Vit. B2
Vitamin B3
Vit. B3
Vitamin B5
Vit. B5
Vitamin B6
Vit. B6
Vitamin B12
Vit. B12
Vitamin K
Vit. K
Folate
Folate
0.67%
0%
27%
0%
47%
42%
16%
29%
14%
21%
0%
20%
All nutrients comparison - raw data values
Nutrient
DV% diff.
Vitamin B12
1.65µg
0.17µg
62%
Saturated fat
17.41g
3.989g
61%
Polyunsaturated fat
0.826g
5.71g
33%
Protein
20.75g
4.9g
32%
Manganese
0.034mg
0.712mg
29%
Vitamin B2
0.52mg
0.18mg
26%
Copper
0.019mg
0.211mg
21%
Carbs
0.45g
52.2g
17%
Sodium
629mg
262mg
16%
Calcium
184mg
32mg
15%
Phosphorus
188mg
94mg
13%
Vitamin B6
0.235mg
0.06mg
13%
Iron
0.5mg
1.48mg
12%
Zinc
2.38mg
1.02mg
12%
Vitamin A
174µg
82µg
10%
Vitamin B1
0.07mg
0.188mg
10%
Folate
65µg
26µg
10%
Fats
27.68g
22.2g
8%
Monounsaturated fat
8.013g
11.181g
8%
Selenium
14.5µg
12µg
5%
Calories
334kcal
412kcal
4%
Cholesterol
100mg
87mg
4%
Vitamin B5
0.69mg
0.479mg
4%
Vitamin D*
20 IU
3%
Vitamin D
0.5µg
3%
Vitamin B3
0.38mg
0.847mg
3%
Choline
15.4mg
3%
Vitamin E
0.24mg
2%
Vitamin K
2.3µg
2%
Magnesium
20mg
26mg
1%
Potassium
152mg
133mg
1%
Protein per 100 calories
6.2g
1.2g
N/A
Calories per 10 g protein
161kcal
841kcal
N/A
Weight per 100 calories
30g
24g
N/A
Unsaturated / Saturated Fat ratio
0.51
4.2
N/A
Vitamin C
0mg
0.2mg
0%
Net carbs
0.45g
52.2g
N/A
Sugar
0.45g
N/A
Tryptophan
0.322mg
0.069mg
0%
Threonine
0.751mg
0.189mg
0%
Isoleucine
1.015mg
0.223mg
0%
Leucine
1.929mg
0.372mg
0%
Lysine
1.851mg
0.248mg
0%
Methionine
0.592mg
0.125mg
0%
Phenylalanine
1.158mg
0.25mg
0%
Valine
1.34mg
0.255mg
0%
Histidine
0.716mg
0.116mg
0%
Omega-3 - EPA
0g
0.001g
N/A
Omega-3 - DHA
0g
0.008g
N/A
Macronutrient Comparison
Macronutrient breakdown side-by-side comparison
4
21%
28%
48%
3%
Protein:
20.75 g
Fats:
27.68 g
Carbs:
0.45 g
Water:
48.42 g
Other:
2.7 g
1
5%
22%
52%
20%
Protein:
4.9 g
Fats:
22.2 g
Carbs:
52.2 g
Water:
19.5 g
Other:
1.2 g
Contains
more
Protein Protein
+323.5%
Contains
more
Fats Fats
+24.7%
Contains
more
Water Water
+148.3%
Contains
more
Other Other
+125%
Contains
more
Carbs Carbs
+11500%
Fat Type Comparison
Fat type breakdown side-by-side comparison
0
66%
31%
3%
Saturated fat:
Sat. Fat
17.41 g
Monounsaturated fat:
Mono. Fat
8.013 g
Polyunsaturated fat:
Poly. Fat
0.826 g
3
19%
54%
27%
Saturated fat:
Sat. Fat
3.989 g
Monounsaturated fat:
Mono. Fat
11.181 g
Polyunsaturated fat:
Poly. Fat
5.71 g
Contains
less
Sat. Fat Saturated fat
-77.1%
Contains
more
Mono. Fat Monounsaturated fat
+39.5%
Contains
more
Poly. Fat Polyunsaturated fat
+591.3%