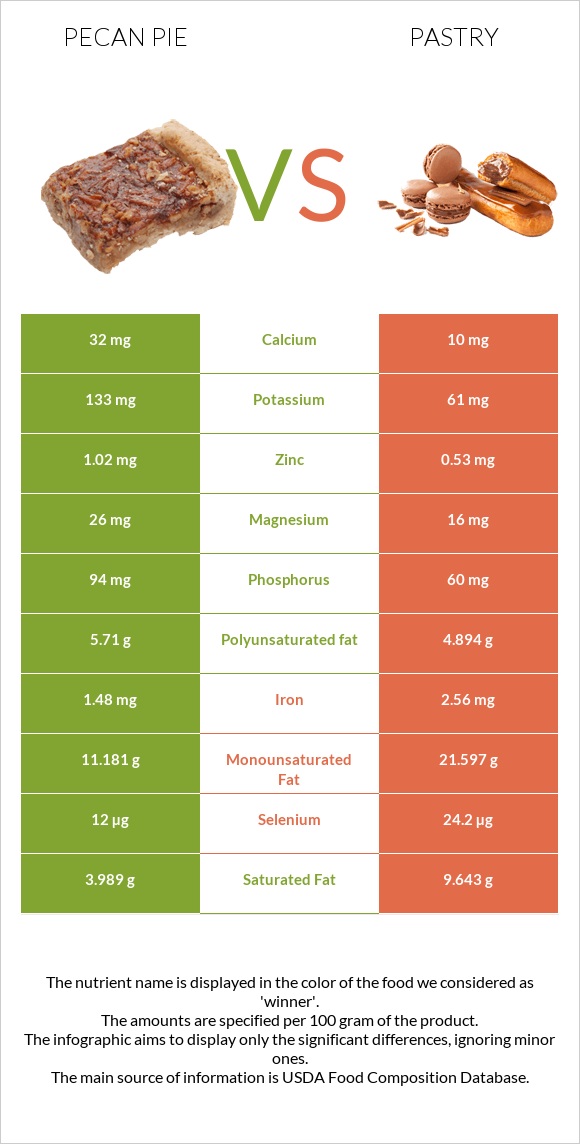
Important differences between pecan pie and pastry Pecan pie has more copper, manganese, and vitamin B5; however, pastry has more selenium, vitamin B3, vitamin B1, iron, and folate. Pecan pie's daily need coverage for cholesterol is 29% more. Pastry is lower in cholesterol. The food varieties used in the comparison are Pie, pecan, prepared from recipe and Puff pastry, frozen, ready-to-bake .
Infographic
Mineral Comparison
Mineral comparison score is based on the number of minerals by which one or the other food is richer. The "coverage" charts below show how much of the daily needs can be covered by 300 grams of the food.
7
100 g
300 g
1 oz - 28.35g 1 piece (1/8 of 9" dia) - 122g
Magnesium
Magnesium
Calcium
Calcium
Potassium
Potassium
Iron
Iron
Copper
Copper
Zinc
Zinc
Phosphorus
Phosphorus
Sodium
Sodium
Manganese
Manganese
Selenium
Selenium
19%
9.6%
12%
56%
70%
28%
40%
34%
93%
65%
2
100 g
300 g
1 oz - 28.35g 1 shell - 47g
Magnesium
Magnesium
Calcium
Calcium
Potassium
Potassium
Iron
Iron
Copper
Copper
Zinc
Zinc
Phosphorus
Phosphorus
Sodium
Sodium
Manganese
Manganese
Selenium
Selenium
11%
3%
5.4%
96%
38%
14%
26%
32%
64%
132%
Vitamin Comparison
Vitamin comparison score is based on the number of vitamins by which one or the other food is richer. The "coverage" charts below show how much of the daily needs can be covered by 300 grams of the food.
5
100 g
300 g
1 oz - 28.35g 1 piece (1/8 of 9" dia) - 122g
Vitamin C
Vit. C
Vitamin D
Vit. D
Vitamin A
Vit. A
Vitamin E
Vit. E
Vitamin B1
Vit. B1
Vitamin B2
Vit. B2
Vitamin B3
Vit. B3
Vitamin B5
Vit. B5
Vitamin B6
Vit. B6
Vitamin B12
Vit. B12
Vitamin K
Vit. K
Folate
Folate
0.67%
0%
27%
0%
47%
42%
16%
29%
14%
21%
0%
20%
6
100 g
300 g
1 oz - 28.35g 1 shell - 47g
Vitamin C
Vit. C
Vitamin D
Vit. D
Vitamin A
Vit. A
Vitamin E
Vit. E
Vitamin B1
Vit. B1
Vitamin B2
Vit. B2
Vitamin B3
Vit. B3
Vitamin B5
Vit. B5
Vitamin B6
Vit. B6
Vitamin B12
Vit. B12
Vitamin K
Vit. K
Folate
Folate
0%
0%
0%
11%
100%
65%
78%
0%
4.8%
0%
40%
59%
All nutrients comparison - raw data values
Nutrient
DV% diff.
Cholesterol
87mg
0mg
29%
Saturated fat
3.989g
9.643g
26%
Monounsaturated fat
11.181g
21.597g
26%
Fats
22.2g
38.1g
24%
Selenium
12µg
24.2µg
22%
Vitamin B3
0.847mg
4.168mg
21%
Vitamin B1
0.188mg
0.398mg
18%
Iron
1.48mg
2.56mg
14%
Vitamin K
16.1µg
13%
Folate
26µg
78µg
13%
Copper
0.211mg
0.114mg
11%
Manganese
0.712mg
0.488mg
10%
Vitamin B5
0.479mg
0mg
10%
Vitamin A
82µg
0µg
9%
Vitamin B2
0.18mg
0.283mg
8%
Calories
412kcal
551kcal
7%
Vitamin B12
0.17µg
0µg
7%
Fiber
1.5g
6%
Protein
4.9g
7.3g
5%
Phosphorus
94mg
60mg
5%
Polyunsaturated fat
5.71g
4.894g
5%
Zinc
1.02mg
0.53mg
4%
Vitamin E
0.54mg
4%
Vitamin B6
0.06mg
0.021mg
3%
Carbs
52.2g
45.1g
2%
Magnesium
26mg
16mg
2%
Calcium
32mg
10mg
2%
Potassium
133mg
61mg
2%
Sodium
262mg
249mg
1%
Choline
6.4mg
1%
Protein per 100 calories
1.2g
1.3g
N/A
Calories per 10 g protein
841kcal
755kcal
N/A
Weight per 100 calories
24g
18g
N/A
Unsaturated / Saturated Fat ratio
4.2
2.7
N/A
Vitamin C
0.2mg
0mg
0%
Net carbs
52.2g
43.6g
N/A
Sugar
0.74g
N/A
Tryptophan
0.069mg
0.085mg
0%
Threonine
0.189mg
0.196mg
0%
Isoleucine
0.223mg
0.272mg
0%
Leucine
0.372mg
0.508mg
0%
Lysine
0.248mg
0.142mg
0%
Methionine
0.125mg
0.129mg
0%
Phenylalanine
0.25mg
0.362mg
0%
Valine
0.255mg
0.308mg
0%
Histidine
0.116mg
0.156mg
0%
Omega-3 - EPA
0.001g
0g
N/A
Omega-3 - DHA
0.008g
0g
N/A
Macronutrient Comparison
Macronutrient breakdown side-by-side comparison
3
5%
22%
52%
20%
Protein:
4.9 g
Fats:
22.2 g
Carbs:
52.2 g
Water:
19.5 g
Other:
1.2 g
2
7%
38%
45%
9%
Protein:
7.3 g
Fats:
38.1 g
Carbs:
45.1 g
Water:
8.5 g
Other:
1 g
Contains
more
Carbs Carbs
+15.7%
Contains
more
Water Water
+129.4%
Contains
more
Other Other
+20%
Contains
more
Protein Protein
+49%
Contains
more
Fats Fats
+71.6%
Fat Type Comparison
Fat type breakdown side-by-side comparison
2
19%
54%
27%
Saturated fat:
Sat. Fat
3.989 g
Monounsaturated fat:
Mono. Fat
11.181 g
Polyunsaturated fat:
Poly. Fat
5.71 g
1
27%
60%
14%
Saturated fat:
Sat. Fat
9.643 g
Monounsaturated fat:
Mono. Fat
21.597 g
Polyunsaturated fat:
Poly. Fat
4.894 g
Contains
less
Sat. Fat Saturated fat
-58.6%
Contains
more
Poly. Fat Polyunsaturated fat
+16.7%
Contains
more
Mono. Fat Monounsaturated fat
+93.2%