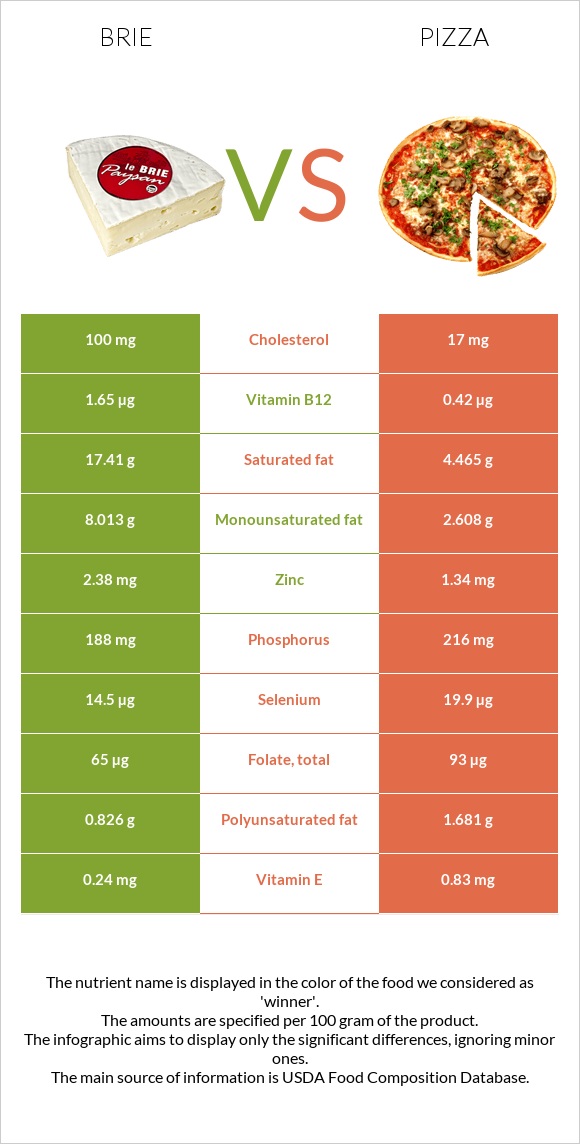
A recap on the differences between brie and pizza Brie is higher in vitamin B12, vitamin B2, and vitamin B6, yet pizza is higher in vitamin B1, iron, vitamin B3, manganese, and selenium. Brie covers your daily saturated fat needs 65% more than pizza. Brie contains 6 times more cholesterol than pizza. While brie contains 100mg of cholesterol, pizza contains only 17mg. The glycemic index of brie is lower. Food varieties used in this article are Cheese, brie and Fast Food, Pizza Chain, 14" pizza, cheese topping, regular crust .
Infographic
Mineral Comparison
Mineral comparison score is based on the number of minerals by which one or the other food is richer. The "coverage" charts below show how much of the daily needs can be covered by 300 grams of the food.
1
100 g
300 g
1 cubic inch - 17g 1 oz - 28.35g 1 package (4.5 oz) - 128g 1 cup, sliced - 144g 1 cup, melted - 240g
Magnesium
Magnesium
Calcium
Calcium
Potassium
Potassium
Iron
Iron
Copper
Copper
Zinc
Zinc
Phosphorus
Phosphorus
Sodium
Sodium
Manganese
Manganese
Selenium
Selenium
14%
55%
13%
19%
6.3%
65%
81%
82%
4.4%
79%
7
100 g
300 g
1 slice - 107g 1 pizza - 853g
Magnesium
Magnesium
Calcium
Calcium
Potassium
Potassium
Iron
Iron
Copper
Copper
Zinc
Zinc
Phosphorus
Phosphorus
Sodium
Sodium
Manganese
Manganese
Selenium
Selenium
17%
56%
15%
93%
35%
37%
93%
78%
47%
109%
Vitamin Comparison
Vitamin comparison score is based on the number of vitamins by which one or the other food is richer. The "coverage" charts below show how much of the daily needs can be covered by 300 grams of the food.
6
100 g
300 g
1 cubic inch - 17g 1 oz - 28.35g 1 package (4.5 oz) - 128g 1 cup, sliced - 144g 1 cup, melted - 240g
Vitamin C
Vit. C
Vitamin D
Vit. D
Vitamin A
Vit. A
Vitamin E
Vit. E
Vitamin B1
Vit. B1
Vitamin B2
Vit. B2
Vitamin B3
Vit. B3
Vitamin B5
Vit. B5
Vitamin B6
Vit. B6
Vitamin B12
Vit. B12
Vitamin K
Vit. K
Folate
Folate
0%
7.5%
58%
4.8%
18%
120%
7.1%
41%
54%
206%
5.8%
49%
6
100 g
300 g
1 slice - 107g 1 pizza - 853g
Vitamin C
Vit. C
Vitamin D
Vit. D
Vitamin A
Vit. A
Vitamin E
Vit. E
Vitamin B1
Vit. B1
Vitamin B2
Vit. B2
Vitamin B3
Vit. B3
Vitamin B5
Vit. B5
Vitamin B6
Vit. B6
Vitamin B12
Vit. B12
Vitamin K
Vit. K
Folate
Folate
4.7%
0%
23%
17%
98%
45%
72%
0%
18%
53%
17%
70%
All nutrients comparison - raw data values
Nutrient
DV% diff.
Saturated fat
17.41g
4.465g
59%
Vitamin B12
1.65µg
0.42µg
51%
Fats
27.68g
9.69g
28%
Cholesterol
100mg
17mg
28%
Vitamin B1
0.07mg
0.39mg
27%
Iron
0.5mg
2.48mg
25%
Vitamin B2
0.52mg
0.195mg
25%
Vitamin B3
0.38mg
3.825mg
22%
Protein
20.75g
11.39g
19%
Manganese
0.034mg
0.36mg
14%
Vitamin B5
0.69mg
14%
Monounsaturated fat
8.013g
2.608g
14%
Vitamin A
174µg
69µg
12%
Vitamin B6
0.235mg
0.08mg
12%
Carbs
0.45g
33.33g
11%
Starch
26.95g
11%
Copper
0.019mg
0.105mg
10%
Selenium
14.5µg
19.9µg
10%
Fiber
0g
2.3g
9%
Zinc
2.38mg
1.34mg
9%
Folate
65µg
93µg
7%
Polyunsaturated fat
0.826g
1.681g
6%
Phosphorus
188mg
216mg
4%
Vitamin E
0.24mg
0.83mg
4%
Vitamin K
2.3µg
6.7µg
4%
Calories
334kcal
266kcal
3%
Vitamin D*
20 IU
0 IU
3%
Vitamin D
0.5µg
0µg
3%
Vitamin C
0mg
1.4mg
2%
Magnesium
20mg
24mg
1%
Potassium
152mg
172mg
1%
Sodium
629mg
598mg
1%
Fructose
1g
1%
Protein per 100 calories
6.2g
4.3g
N/A
Calories per 10 g protein
161kcal
234kcal
N/A
Weight per 100 calories
30g
38g
N/A
Unsaturated / Saturated Fat ratio
0.51
0.96
N/A
Net carbs
0.45g
31.03g
N/A
Calcium
184mg
188mg
0%
Sugar
0.45g
3.58g
N/A
Trans fat
0.241g
N/A
Choline
15.4mg
16.4mg
0%
Tryptophan
0.322mg
0%
Threonine
0.751mg
0.41mg
0%
Isoleucine
1.015mg
0.564mg
0%
Leucine
1.929mg
1.139mg
0%
Lysine
1.851mg
0.77mg
0%
Methionine
0.592mg
0.264mg
0%
Phenylalanine
1.158mg
0.664mg
0%
Valine
1.34mg
0.72mg
0%
Histidine
0.716mg
0.355mg
0%
Omega-3 - EPA
0g
0.004g
N/A
Omega-3 - ALA
0.175g
N/A
Omega-3 - DPA
0g
0.004g
N/A
Omega-6 - Gamma-linoleic acid
0.003g
N/A
Omega-6 - Dihomo-gamma-linoleic acid
0.009g
N/A
Omega-6 - Eicosadienoic acid
0.003g
N/A
Omega-6 - Linoleic acid
1.367g
N/A
Macronutrient Comparison
Macronutrient breakdown side-by-side comparison
4
21%
28%
48%
3%
Protein:
20.75 g
Fats:
27.68 g
Carbs:
0.45 g
Water:
48.42 g
Other:
2.7 g
1
11%
10%
33%
43%
2%
Protein:
11.39 g
Fats:
9.69 g
Carbs:
33.33 g
Water:
43.17 g
Other:
2.42 g
Contains
more
Protein Protein
+82.2%
Contains
more
Fats Fats
+185.7%
Contains
more
Water Water
+12.2%
Contains
more
Other Other
+11.6%
Contains
more
Carbs Carbs
+7306.7%
Fat Type Comparison
Fat type breakdown side-by-side comparison
1
66%
31%
3%
Saturated fat:
Sat. Fat
17.41 g
Monounsaturated fat:
Mono. Fat
8.013 g
Polyunsaturated fat:
Poly. Fat
0.826 g
2
51%
30%
19%
Saturated fat:
Sat. Fat
4.465 g
Monounsaturated fat:
Mono. Fat
2.608 g
Polyunsaturated fat:
Poly. Fat
1.681 g
Contains
more
Mono. Fat Monounsaturated fat
+207.2%
Contains
less
Sat. Fat Saturated fat
-74.4%
Contains
more
Poly. Fat Polyunsaturated fat
+103.5%