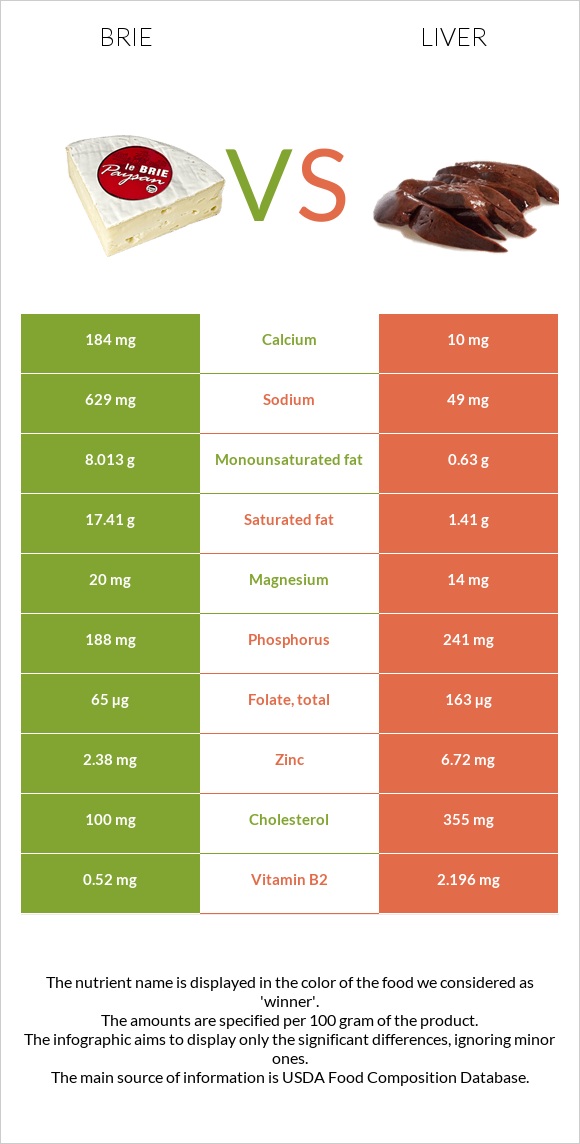
What are the differences between brie and liver? Liver is richer than brie in vitamin B12, vitamin A, iron, vitamin B2, selenium, vitamin B5, copper, and vitamin B3. Liver's daily need coverage for vitamin B12 is 709% more. Brie has 12 times more saturated fat than liver. While brie has 17.41g of saturated fat, liver has only 1.41g. We used Cheese, brie and Pork, fresh, variety meats, and by-products, liver, cooked, braised types in this article.
Infographic
Mineral Comparison
Mineral comparison score is based on the number of minerals by which one or the other food is richer. The "coverage" charts below show how much of the daily needs can be covered by 300 grams of the food.
2
100 g
300 g
1 cubic inch - 17g 1 oz - 28.35g 1 package (4.5 oz) - 128g 1 cup, sliced - 144g 1 cup, melted - 240g
Magnesium
Magnesium
Calcium
Calcium
Potassium
Potassium
Iron
Iron
Copper
Copper
Zinc
Zinc
Phosphorus
Phosphorus
Sodium
Sodium
Manganese
Manganese
Selenium
Selenium
14%
55%
13%
19%
6.3%
65%
81%
82%
4.4%
79%
7
100 g
300 g
3 oz - 85g
Magnesium
Magnesium
Calcium
Calcium
Potassium
Potassium
Iron
Iron
Copper
Copper
Zinc
Zinc
Phosphorus
Phosphorus
Sodium
Sodium
Manganese
Manganese
Selenium
Selenium
10%
3%
13%
672%
211%
183%
103%
6.4%
39%
368%
Vitamin Comparison
Vitamin comparison score is based on the number of vitamins by which one or the other food is richer. The "coverage" charts below show how much of the daily needs can be covered by 300 grams of the food.
3
100 g
300 g
1 cubic inch - 17g 1 oz - 28.35g 1 package (4.5 oz) - 128g 1 cup, sliced - 144g 1 cup, melted - 240g
Vitamin C
Vit. C
Vitamin D
Vit. D
Vitamin A
Vit. A
Vitamin E
Vit. E
Vitamin B1
Vit. B1
Vitamin B2
Vit. B2
Vitamin B3
Vit. B3
Vitamin B5
Vit. B5
Vitamin B6
Vit. B6
Vitamin B12
Vit. B12
Vitamin K
Vit. K
Folate
Folate
0%
7.5%
58%
4.8%
18%
120%
7.1%
41%
54%
206%
5.8%
49%
9
100 g
300 g
3 oz - 85g
Vitamin C
Vit. C
Vitamin D
Vit. D
Vitamin A
Vit. A
Vitamin E
Vit. E
Vitamin B1
Vit. B1
Vitamin B2
Vit. B2
Vitamin B3
Vit. B3
Vitamin B5
Vit. B5
Vitamin B6
Vit. B6
Vitamin B12
Vit. B12
Vitamin K
Vit. K
Folate
Folate
79%
0%
1802%
0%
65%
507%
158%
286%
132%
2334%
0%
122%
All nutrients comparison - raw data values
Nutrient
DV% diff.
Vitamin B12
1.65µg
18.67µg
709%
Vitamin A
174µg
5405µg
581%
Iron
0.5mg
17.92mg
218%
Vitamin B2
0.52mg
2.196mg
129%
Selenium
14.5µg
67.5µg
96%
Cholesterol
100mg
355mg
85%
Vitamin B5
0.69mg
4.774mg
82%
Saturated fat
17.41g
1.41g
73%
Copper
0.019mg
0.634mg
68%
Vitamin B3
0.38mg
8.435mg
50%
Zinc
2.38mg
6.72mg
39%
Fats
27.68g
4.4g
36%
Vitamin C
0mg
23.6mg
26%
Vitamin B6
0.235mg
0.57mg
26%
Sodium
629mg
49mg
25%
Folate
65µg
163µg
25%
Monounsaturated fat
8.013g
0.63g
18%
Calcium
184mg
10mg
17%
Vitamin B1
0.07mg
0.258mg
16%
Manganese
0.034mg
0.3mg
12%
Protein
20.75g
26.02g
11%
Calories
334kcal
165kcal
8%
Phosphorus
188mg
241mg
8%
Vitamin D*
20 IU
3%
Vitamin D
0.5µg
3%
Choline
15.4mg
3%
Vitamin E
0.24mg
2%
Vitamin K
2.3µg
2%
Carbs
0.45g
3.76g
1%
Magnesium
20mg
14mg
1%
Polyunsaturated fat
0.826g
1.05g
1%
Protein per 100 calories
6.2g
16g
N/A
Calories per 10 g protein
161kcal
63kcal
N/A
Weight per 100 calories
30g
61g
N/A
Unsaturated / Saturated Fat ratio
0.51
1.2
N/A
Net carbs
0.45g
3.76g
N/A
Potassium
152mg
150mg
0%
Sugar
0.45g
N/A
Tryptophan
0.322mg
0.366mg
0%
Threonine
0.751mg
1.107mg
0%
Isoleucine
1.015mg
1.32mg
0%
Leucine
1.929mg
2.319mg
0%
Lysine
1.851mg
2.007mg
0%
Methionine
0.592mg
0.645mg
0%
Phenylalanine
1.158mg
1.274mg
0%
Valine
1.34mg
1.607mg
0%
Histidine
0.716mg
0.708mg
0%
Omega-3 - DHA
0g
0.03g
N/A
Omega-3 - DPA
0g
0.04g
N/A
Macronutrient Comparison
Macronutrient breakdown side-by-side comparison
2
21%
28%
48%
3%
Protein:
20.75 g
Fats:
27.68 g
Carbs:
0.45 g
Water:
48.42 g
Other:
2.7 g
3
26%
4%
4%
64%
Protein:
26.02 g
Fats:
4.4 g
Carbs:
3.76 g
Water:
64.32 g
Other:
1.5 g
Contains
more
Fats Fats
+529.1%
Contains
more
Other Other
+80%
Contains
more
Protein Protein
+25.4%
Contains
more
Carbs Carbs
+735.6%
Contains
more
Water Water
+32.8%
Fat Type Comparison
Fat type breakdown side-by-side comparison
1
66%
31%
3%
Saturated fat:
Sat. Fat
17.41 g
Monounsaturated fat:
Mono. Fat
8.013 g
Polyunsaturated fat:
Poly. Fat
0.826 g
2
46%
20%
34%
Saturated fat:
Sat. Fat
1.41 g
Monounsaturated fat:
Mono. Fat
0.63 g
Polyunsaturated fat:
Poly. Fat
1.05 g
Contains
more
Mono. Fat Monounsaturated fat
+1171.9%
Contains
less
Sat. Fat Saturated fat
-91.9%
Contains
more
Poly. Fat Polyunsaturated fat
+27.1%