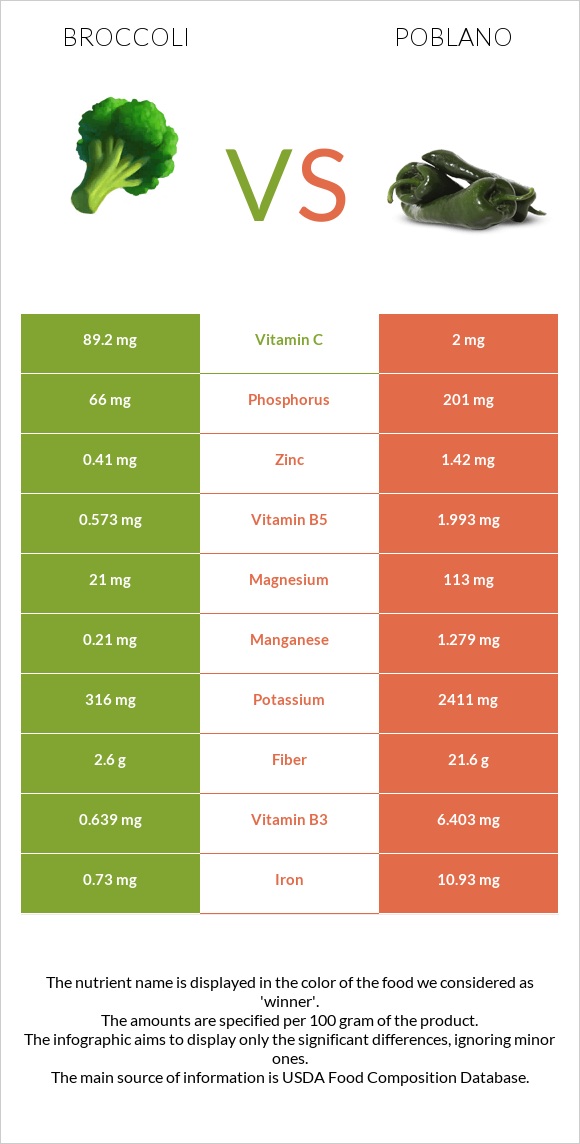
How are broccoli and poblano different? Broccoli is richer in vitamin C, while poblano is higher in vitamin A, vitamin B6, vitamin B2, iron, fiber, potassium, copper, manganese, and vitamin B3. Poblano covers your daily need for vitamin A, 396% more than broccoli. Broccoli contains 45 times more vitamin C than poblano. Broccoli contains 89.2mg of vitamin C, while poblano contains 2mg. Broccoli, raw and Peppers, ancho, dried types were used in this article.
Infographic
Mineral Comparison
Mineral comparison score is based on the number of minerals by which one or the other food is richer. The "coverage" charts below show how much of the daily needs can be covered by 300 grams of the food.
1
100 g
300 g
1 spear (about 5" long) - 31g 0.5 cup, chopped or diced - 44g 1 cup chopped - 91g 1 NLEA serving - 148g 1 stalk - 151g 1 bunch - 608g
Magnesium
Magnesium
Calcium
Calcium
Potassium
Potassium
Iron
Iron
Copper
Copper
Zinc
Zinc
Phosphorus
Phosphorus
Sodium
Sodium
Manganese
Manganese
Selenium
Selenium
15%
14%
28%
27%
16%
11%
28%
4.3%
27%
14%
9
100 g
300 g
1 pepper - 17g
Magnesium
Magnesium
Calcium
Calcium
Potassium
Potassium
Iron
Iron
Copper
Copper
Zinc
Zinc
Phosphorus
Phosphorus
Sodium
Sodium
Manganese
Manganese
Selenium
Selenium
81%
18%
213%
410%
169%
39%
86%
5.6%
167%
16%
Vitamin Comparison
Vitamin comparison score is based on the number of vitamins by which one or the other food is richer. The "coverage" charts below show how much of the daily needs can be covered by 300 grams of the food.
3
100 g
300 g
1 spear (about 5" long) - 31g 0.5 cup, chopped or diced - 44g 1 cup chopped - 91g 1 NLEA serving - 148g 1 stalk - 151g 1 bunch - 608g
Vitamin C
Vit. C
Vitamin D
Vit. D
Vitamin A
Vit. A
Vitamin E
Vit. E
Vitamin B1
Vit. B1
Vitamin B2
Vit. B2
Vitamin B3
Vit. B3
Vitamin B5
Vit. B5
Vitamin B6
Vit. B6
Vitamin B12
Vit. B12
Vitamin K
Vit. K
Folate
Folate
297%
0%
10%
16%
18%
27%
12%
34%
40%
0%
254%
47%
6
100 g
300 g
1 pepper - 17g
Vitamin C
Vit. C
Vitamin D
Vit. D
Vitamin A
Vit. A
Vitamin E
Vit. E
Vitamin B1
Vit. B1
Vitamin B2
Vit. B2
Vitamin B3
Vit. B3
Vitamin B5
Vit. B5
Vitamin B6
Vit. B6
Vitamin B12
Vit. B12
Vitamin K
Vit. K
Folate
Folate
6.7%
0%
341%
0%
45%
520%
120%
120%
816%
0%
0%
52%
All nutrients comparison - raw data values
Nutrient
DV% diff.
Vitamin B6
0.175mg
3.535mg
258%
Vitamin B2
0.117mg
2.255mg
164%
Iron
0.73mg
10.93mg
128%
Vitamin A
31µg
1022µg
110%
Vitamin C
89.2mg
2mg
97%
Vitamin K
101.6µg
85%
Fiber
2.6g
21.6g
76%
Potassium
316mg
2411mg
62%
Copper
0.049mg
0.508mg
51%
Manganese
0.21mg
1.279mg
46%
Vitamin B3
0.639mg
6.403mg
36%
Polyunsaturated fat
0.038g
4.511g
30%
Vitamin B5
0.573mg
1.993mg
28%
Magnesium
21mg
113mg
22%
Phosphorus
66mg
201mg
19%
Protein
2.82g
11.86g
18%
Carbs
6.64g
51.42g
15%
Calories
34kcal
281kcal
12%
Fats
0.37g
8.2g
12%
Zinc
0.41mg
1.42mg
9%
Vitamin B1
0.071mg
0.179mg
9%
Vitamin E
0.78mg
5%
Saturated fat
0.039g
0.82g
4%
Choline
18.7mg
3%
Folate
63µg
69µg
2%
Calcium
47mg
61mg
1%
Selenium
2.5µg
2.9µg
1%
Monounsaturated fat
0.011g
0.492g
1%
Fructose
0.68g
1%
Protein per 100 calories
8.3g
4.2g
N/A
Calories per 10 g protein
121kcal
237kcal
N/A
Weight per 100 calories
294g
36g
N/A
Unsaturated / Saturated Fat ratio
1.3
6.1
N/A
Net carbs
4.04g
29.82g
N/A
Sugar
1.7g
N/A
Sodium
33mg
43mg
0%
Tryptophan
0.033mg
0.155mg
0%
Threonine
0.088mg
0.425mg
0%
Isoleucine
0.079mg
0.373mg
0%
Leucine
0.129mg
0.605mg
0%
Lysine
0.135mg
0.515mg
0%
Methionine
0.038mg
0.142mg
0%
Phenylalanine
0.117mg
0.361mg
0%
Valine
0.125mg
0.489mg
0%
Histidine
0.059mg
0.232mg
0%
Macronutrient Comparison
Macronutrient breakdown side-by-side comparison
1
3%
7%
89%
Protein:
2.82 g
Fats:
0.37 g
Carbs:
6.64 g
Water:
89.3 g
Other:
0.87 g
4
12%
8%
51%
23%
6%
Protein:
11.86 g
Fats:
8.2 g
Carbs:
51.42 g
Water:
22.63 g
Other:
5.89 g
Contains
more
Water Water
+294.6%
Contains
more
Protein Protein
+320.6%
Contains
more
Fats Fats
+2116.2%
Contains
more
Carbs Carbs
+674.4%
Contains
more
Other Other
+577%
Fat Type Comparison
Fat type breakdown side-by-side comparison
1
44%
13%
43%
Saturated fat:
Sat. Fat
0.039 g
Monounsaturated fat:
Mono. Fat
0.011 g
Polyunsaturated fat:
Poly. Fat
0.038 g
2
14%
8%
77%
Saturated fat:
Sat. Fat
0.82 g
Monounsaturated fat:
Mono. Fat
0.492 g
Polyunsaturated fat:
Poly. Fat
4.511 g
Contains
less
Sat. Fat Saturated fat
-95.2%
Contains
more
Mono. Fat Monounsaturated fat
+4372.7%
Contains
more
Poly. Fat Polyunsaturated fat
+11771.1%