Buttermilk vs. Yogurt — Health Impact and Nutrition Comparison


Summary
Both of these are low in calories. Buttermilk and yogurt are mostly composed of water. 100g of buttermilk has 90g of water, while 100g of yogurt contains 85g of water.
Yogurt is richer in proteins compared to buttermilk. Both of these products contain essential amino acids. They contain negligible amounts of fats. Buttermilk and yogurt are classified as low glycemic index foods.
Buttermilk is richer in fat-soluble vitamins such as vitamins A, D, E, K and water-soluble vitamins like vitamins C and B1 compared to yogurt. Yogurt, on the other hand, is richer in vitamins B2, B3, B5, B6, B9, and B12.
Buttermilk and yogurt are among the foods that are rich in calcium. They have nearly equal amounts of calcium, and both satisfy the daily calcium requirement by 12%.
Introduction
Buttermilk is a byproduct of milk production during butter production. Commercial buttermilk is prepared by pasteurizing fermented milk with bacteria that produce acidic compounds. This gives buttermilk its taste and texture, which are creamy and buttery.
Yogurt is the product of the fermentation and processing of milk. There are two types of yogurt: the first is sweet and often mixed with fruits and sugar. The second type of yogurt is sour and salty and is directly consumed without processing after fermentation. Yogurt has a wide range of uses in the culinary world. It is often used as plain yogurt, as a component in cooking, or as a dessert.
This text will look into the differences and similarities between buttermilk and yogurt and how they impact our health.
The buttermilk taken into consideration in this article is low-fat buttermilk. The yogurt taken into consideration is non-fat yogurt.
Nutrition
The nutritional values are described for 100-gram servings of buttermilk (cultured, low-fat) and yogurt (Greek, plain, nonfat).
Buttermilk and yogurt are mostly composed of water. In 100g of buttermilk, there is 90g of water, and for 100g of yogurt, there is 85g of water.
Calories
A hundred grams of buttermilk and yogurt have approximately similar caloric profiles. Buttermilk has 40 calories per 100 g, compared to yogurt, which has 59 calories per 100g. Hence, buttermilk has fewer calories than yogurt. However, both are considered low-calorie foods.
Proteins
Yogurt is richer in proteins compared to buttermilk. Yogurt has 10.19g of proteins per 100g which is 24% of the daily recommended value. In contrast, buttermilk has 3.31g of protein which is 7.8% of the daily recommended value.
Unlike yogurt, buttermilk contains essential amino acids such as methionine, isoleucine, phenylalanine, tryptophan, threonine, leucine, lysine, valine, and histidine, which are not synthesized in the human body but are necessary for a variety of physiological processes.
Fats
Yogurt has negligible fats; as noted before, we are considering non-fat yogurt in this article. Yet, we can say that it is also negligible. Yogurt has 0.39g of fat which is less than 1% of the daily recommended value. On the other hand, buttermilk has relatively higher fats (0.88g per 100g).
Buttermilk contains more saturated, mono-, and polyunsaturated fats than yogurt, which contains omega-3 and omega-6 in small quantities.
We can conclude that both have negligible amounts of fats.
Carbs
Buttermilk has more carbohydrates compared to yogurt. Buttermilk has 4.79g of carbs per 100g compared to yogurt, which has 3.6g per 100g. Both of these values are less than 1% of the daily recommended value.
Glycemic index
Buttermilk and yogurt are classified as low glycemic index foods. Buttermilk’s glycemic index is 31, while yogurt has a glycemic index of 19.
Vitamins
Buttermilk is richer in fat-soluble vitamins such as vitamins A, D, E, K and water-soluble vitamins like vitamins C and B1 compared to yogurt. However, these amounts are not very remarkable relative to the daily recommended values. Yogurt, on the other hand, is richer in vitamins B2, B3, B5, B6, B9, and B12.
Vitamin Comparison
Contains
more
Vitamin CVitamin C
+∞%
Contains
more
Vitamin AVitamin A
+1300%
Contains
more
Vitamin EVitamin E
+400%
Contains
more
Vitamin B1Vitamin B1
+47.8%
Contains
more
Vitamin KVitamin K
+∞%
Contains
more
Vitamin B2Vitamin B2
+80.5%
Contains
more
Vitamin B3Vitamin B3
+258.6%
Contains
more
Vitamin B5Vitamin B5
+20.4%
Contains
more
Vitamin B6Vitamin B6
+85.3%
Contains
more
Vitamin B12Vitamin B12
+240.9%
Contains
more
FolateFolate
+40%
Minerals
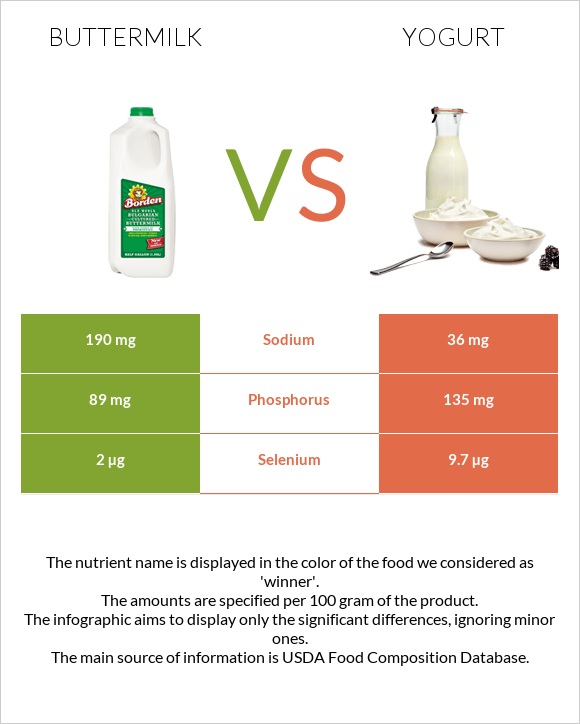
Buttermilk and yogurt are among the foods that are rich in calcium. They have nearly equal amounts of calcium, and both satisfy the daily calcium requirement by 12%.
Buttermilk is higher in potassium and sodium than yogurt, which is higher in iron, phosphorus, zinc, copper, manganese, and selenium. Both contain equal amounts of magnesium.
Mineral Comparison
Contains
more
IronIron
+40%
Contains
more
CopperCopper
+54.5%
Contains
more
ZincZinc
+23.8%
Contains
more
PhosphorusPhosphorus
+51.7%
Contains
less
SodiumSodium
-81.1%
Contains
more
ManganeseManganese
+350%
Contains
more
SeleniumSelenium
+385%
Weight loss and Diets
According to research, dairy products (including buttermilk and yogurt) may reduce the risk of obesity (1.2). It should be mentioned that some dairy products contain a lot of fat and should be consumed in moderation.
Keto
When used in moderation, buttermilk is keto-friendly. Consuming a cup (245g) of buttermilk in one meal, on the other hand, is not keto-friendly because it contains a considerable amount of carbs. Yogurt is also keto-friendly, but it should be free of additions like carbohydrates.
The Mediterranean diet
The Mediterranean diet profile emphasizes whole grains, beneficial fats (fish, olive oil, nuts, etc.), vegetables, fruits, fish, and very little non-fish meat consumption. It should be emphasized that dairy products such as buttermilk and low-fat yogurt are essential components of the diet. It should be mentioned that these products should be consumed in moderation.
Paleo
A paleo diet often consists of lean meats, fish, fruits, vegetables, nuts, and seeds—items that could have been obtained through hunting and gathering in the past. Dairy products like these are not allowed.
DASH
The DASH (Dietary Approaches to Stop Hypertension) diet comprises foods high in potassium, calcium, and magnesium, all of which aid with blood pressure control. Because these foods are high in calcium and protein, they are allowed in moderation throughout this diet.
Health impacts
Cardiovascular health
Both of these products may lower cholesterol levels in the blood through various mechanisms. Studies have shown that consumption of buttermilk may inhibit the absorption of cholesterol from the intestine, and yogurt consumption may inhibit LDL (bad) cholesterol levels in the blood so that they may lower the risk of cardiovascular diseases, including the risk of heart attacks (3.4.5).
Buttermilk and yogurt contain some proteins that may inhibit ACE (angiotensin-converting enzyme), which in turn may reduce arterial blood pressure and prevent arterial and myocardial remodeling (6.7). Some drugs, such as Captopril, Perindopril, and Lisinopril, work in the same way (8).
In addition, some studies found that regular consumption of yogurt may decrease mortality rates from cardiovascular diseases (9).
Diabetes mellitus
The following study shows a direct relationship between the reduction of type 2 diabetes and dairy consumption. However, this is dose-dependent, meaning that moderate amounts have to be consumed without adding added sugars and syrups (10).
Yogurt is considered a probiotic, keeping the normal gut microflora healthy and active and thus regulating blood glucose levels. This, in turn, helps decrease the risk of type 2 diabetes (11).
Studies found inverse relationships between skimmed and fermented dairy products and pre-diabetes (fasting blood glucose levels range from 100 to 125 mg/dL, or 5.6 to 6.9 mmol/L), while there were unfavorable associations between full-fat and non-fermented dairy products and pre-diabetes. It should be noted that lifestyle changes and glycemic monitoring are recommended at these glucose levels to prevent diabetes (12.13).
Based on the information shown above, patients with diabetes and pre-diabetes should consume low-fat buttermilk and yogurt with no added sugars.
Cancer
The following study shows the effects of the consumption of buttermilk on colon cancer cells in vitro. It was observed that buttermilk has an antiproliferative effect on cancer cells. The antiproliferative effect is the halting of cell division (14). As for yogurt, according to this study, yogurt's anticancer effect may be mediated through an anti-inflammatory action on colon mucosa (15). It should be noted that further research is needed for more accurate information.
Both of these products have antiproliferative effects. One study sheds light on the antiproliferative effect of buttermilk when it is used as a food additive instead of other harmful additives that are commonly used to preserve food for longer durations (16.17).
Some studies focus on the effects of yogurt and buttermilk and their reduction of the risk of developing bladder cancer (18.19). Yogurt consumption may also reduce the risk of upper aerodigestive tract (UADT) cancer (20). This effect is unknown for buttermilk.
It should be mentioned that high diets in calcium have been shown to increase the risks of prostate cancer (21).
Bone Health
Calcium, protein, and vitamin D are all important for bone health. To varied degrees, potassium, magnesium, zinc, and other vitamins are also involved. Consumption of dairy products like buttermilk and yogurt is necessary not only for calcium but also for protein and potassium (22.23).
The prevention of bone loss during menopause and postmenopause is a major concern for women. Osteoporosis is increased during menopause due to bone loss.
Premenopausal women and men should ingest at least 1000 mg of calcium every day, according to experts. Postmenopausal women should get 1200 mg of calcium per day (from food and supplements combined). However, due to the risk of negative effects, you should not exceed 2000 mg of calcium each day (24).
Milk and dairy products such as buttermilk, yogurt, and green vegetables are the most common sources of calcium. To estimate your dietary calcium intake, multiply the number of dairy servings you consume each day by 300 mg. 1 cup of buttermilk (245 mL) or yogurt (170 g) is an example of a serving (24).
If you don't obtain enough calcium from your diet, your doctor may recommend calcium supplements (24).
Digestive Health
Lactose intolerance is a disorder that makes it difficult for your body to absorb milk and dairy products. If you have lactose intolerance and consume dairy products, you may get diarrhea, stomach pain, and gas.
Various treatments are available based on the severity of the problem. However, in general, treatment may include: eating less dairy food; finding non-dairy sources of nutrients (such as calcium and vitamin D); and taking an enzyme supplement to help you break down dairy foods because the body either does not produce enough of the enzyme (that breaks down lactose, the main form of sugar found in milk) or the enzyme does not work as well as it should (25).
References
- https://pubmed.ncbi.nlm.nih.gov/27228702/
- https://d1wqtxts1xzle7.cloudfront.net/38520958/IMS_Milk_and_anthropometric_measurements_study-libre.pdf?1440045548=&response-content-disposition=inline%3B+fil
- https://pubmed.ncbi.nlm.nih.gov/23786821/
- https://pubmed.ncbi.nlm.nih.gov/25394286/
- https://pubmed.ncbi.nlm.nih.gov/29462263/
- https://www.sciencedirect.com/science/article/abs/pii/S1466856422003514
- https://link.springer.com/article/10.1007/s10989-018-9679-8
- https://pubmed.ncbi.nlm.nih.gov/11030016/
- https://pubmed.ncbi.nlm.nih.gov/31968071/
- https://www.ncbi.nlm.nih.gov/pmc/articles/PMC3719038/
- https://pubmed.ncbi.nlm.nih.gov/28615384/
- https://www.cambridge.org/core/journals/british-journal-of-nutrition/article/dairy-product-consumption-is-associated-with-prediabetes-and-newly-diagnosed-type-2-diabetes-in-the-lifelines-cohort-study/78D973C26561CD25808E8ED6F2BC4044
- https://www.who.int/data/gho/indicator-metadata-registry/imr-details/2380#:~:text=The%20expected%20values%20for%20normal,and%20monitoring%20glycemia%20are%20recommended.
- https://pubmed.ncbi.nlm.nih.gov/27472445/
- https://onlinelibrary.wiley.com/doi/full/10.1002/ijc.26193
- https://pubmed.ncbi.nlm.nih.gov/27374586/
- https://www.sciencedirect.com/science/article/pii/S0022030297761836
- https://www.researchgate.net/profile/Priya-Darshane/publication/349711043_Impact_Factor_4656_Available_Online_at_wwwjournalcmprcom_Volume_5_Issue_10A/links/603e046692851c077f0ea68a/Impact-Factor-4656-Available-Online-at-wwwjournalcmprcom-Volume-5-Issue-10A.pdf
- https://academic.oup.com/ajcn/article/88/4/1083/4650143
- https://pubmed.ncbi.nlm.nih.gov/22179690/
- https://pubmed.ncbi.nlm.nih.gov/22081693/
- https://www.tandfonline.com/doi/abs/10.1080/07315724.2009.10719808
- https://pubmed.ncbi.nlm.nih.gov/34494238/
- https://pro.uptodatefree.ir/show/2160
- https://pro.uptodatefree.ir/show/16172

Infographic
All nutrients comparison - raw data values
| Nutrient | |
|
DV% diff. |
| Vitamin B12 | 0.22µg | 0.75µg | 22% |
| Protein | 3.31g | 10.19g | 14% |
| Selenium | 2µg | 9.7µg | 14% |
| Vitamin B2 | 0.154mg | 0.278mg | 10% |
| Phosphorus | 89mg | 135mg | 7% |
| Sodium | 190mg | 36mg | 7% |
| Vitamin B6 | 0.034mg | 0.063mg | 2% |
| Saturated fat | 0.548g | 0.117g | 2% |
| Calories | 40kcal | 59kcal | 1% |
| Fats | 0.88g | 0.39g | 1% |
| Vitamin C | 1mg | 0mg | 1% |
| Calcium | 116mg | 110mg | 1% |
| Copper | 0.011mg | 0.017mg | 1% |
| Zinc | 0.42mg | 0.52mg | 1% |
| Vitamin A | 14µg | 1µg | 1% |
| Vitamin B1 | 0.034mg | 0.023mg | 1% |
| Vitamin B3 | 0.058mg | 0.208mg | 1% |
| Vitamin B5 | 0.275mg | 0.331mg | 1% |
| Folate | 5µg | 7µg | 1% |
| Monounsaturated fat | 0.254g | 0.053g | 1% |
| Protein per 100 calories | 8.3g | 17g | N/A |
| Calories per 10 g protein | 121kcal | 58kcal | N/A |
| Weight per 100 calories | 250g | 169g | N/A |
| Net carbs | 4.79g | 3.6g | N/A |
| Carbs | 4.79g | 3.6g | 0% |
| Cholesterol | 4mg | 5mg | 0% |
| Vitamin D* | 1 IU | 0 IU | 0% |
| Magnesium | 11mg | 11mg | 0% |
| Potassium | 151mg | 141mg | 0% |
| Iron | 0.05mg | 0.07mg | 0% |
| Sugar | 4.79g | 3.24g | N/A |
| Vitamin E | 0.05mg | 0.01mg | 0% |
| Manganese | 0.002mg | 0.009mg | 0% |
| Vitamin K | 0.1µg | 0µg | 0% |
| Trans fat | 0.006g | N/A | |
| Choline | 17.7mg | 15.1mg | 0% |
| Polyunsaturated fat | 0.033g | 0.012g | 0% |
| Tryptophan | 0.042mg | 0% | |
| Threonine | 0.141mg | 0% | |
| Isoleucine | 0.171mg | 0% | |
| Leucine | 0.313mg | 0% | |
| Lysine | 0.277mg | 0% | |
| Methionine | 0.087mg | 0% | |
| Phenylalanine | 0.171mg | 0% | |
| Valine | 0.217mg | 0% | |
| Histidine | 0.1mg | 0% | |
| Omega-3 - ALA | 0.001g | N/A | |
| Omega-6 - Linoleic acid | 0.01g | N/A |
Macronutrient Comparison
| Contains more FatsFats | +125.6% |
| Contains more CarbsCarbs | +33.1% |
| Contains more OtherOther | +23.6% |
| Contains more ProteinProtein | +207.9% |
Fat Type Comparison
| Contains more Mono. FatMonounsaturated fat | +379.2% |
| Contains more Poly. FatPolyunsaturated fat | +175% |
| Contains less Sat. FatSaturated fat | -78.6% |
People also compare


References
All the values for which the sources are not specified explicitly are taken from FDA’s Food Central. The exact link to the food presented on this page can be found below.
- Buttermilk - https://fdc.nal.usda.gov/fdc-app.html#/food-details/170874/nutrients
- Yogurt - https://fdc.nal.usda.gov/fdc-app.html#/food-details/170894/nutrients
All the Daily Values are presented for males aged 31-50, for 2000-calorie diets.