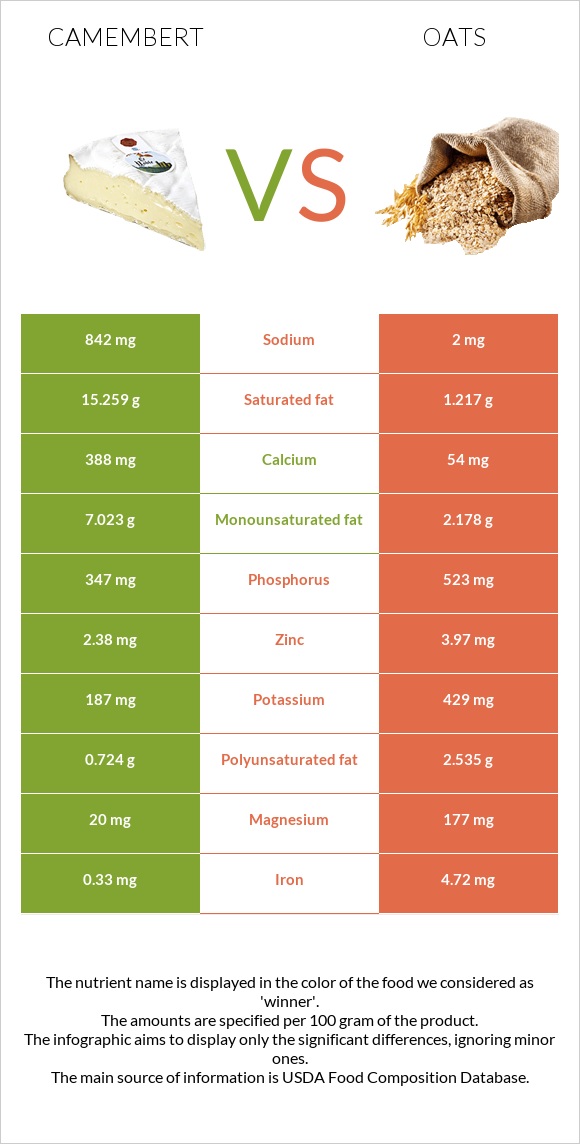
A recap on the differences between camembert and oats Camembert is higher in vitamin B12 and calcium, yet oats are higher in manganese, copper, vitamin B1, iron, fiber, and magnesium. Oats cover your daily manganese needs 212% more than camembert. The amount of sodium in oats is lower. The glycemic index of camembert is lower. Food varieties used in this article are Cheese, camembert and Oats .
Infographic
Mineral Comparison
Mineral comparison score is based on the number of minerals by which one or the other food is richer. The "coverage" charts below show how much of the daily needs can be covered by 300 grams of the food.
2
100 g
300 g
1 cubic inch - 17g 1 oz - 28.35g 1 wedge (1.33 oz) - 38g 1 cup - 246g
Magnesium
Magnesium
Calcium
Calcium
Potassium
Potassium
Iron
Iron
Copper
Copper
Zinc
Zinc
Phosphorus
Phosphorus
Sodium
Sodium
Manganese
Manganese
Selenium
Selenium
14%
116%
17%
12%
7%
65%
149%
110%
5%
79%
8
100 g
300 g
1 cup - 156g
Magnesium
Magnesium
Calcium
Calcium
Potassium
Potassium
Iron
Iron
Copper
Copper
Zinc
Zinc
Phosphorus
Phosphorus
Sodium
Sodium
Manganese
Manganese
Selenium
Selenium
126%
16%
38%
177%
209%
108%
224%
0.26%
641%
0%
Vitamin Comparison
Vitamin comparison score is based on the number of vitamins by which one or the other food is richer. The "coverage" charts below show how much of the daily needs can be covered by 300 grams of the food.
7
100 g
300 g
1 cubic inch - 17g 1 oz - 28.35g 1 wedge (1.33 oz) - 38g 1 cup - 246g
Vitamin C
Vit. C
Vitamin D
Vit. D
Vitamin A
Vit. A
Vitamin E
Vit. E
Vitamin B1
Vit. B1
Vitamin B2
Vit. B2
Vitamin B3
Vit. B3
Vitamin B5
Vit. B5
Vitamin B6
Vit. B6
Vitamin B12
Vit. B12
Vitamin K
Vit. K
Folate
Folate
0%
6%
80%
4.2%
7%
113%
12%
82%
52%
163%
5%
47%
2
100 g
300 g
1 cup - 156g
Vitamin C
Vit. C
Vitamin D
Vit. D
Vitamin A
Vit. A
Vitamin E
Vit. E
Vitamin B1
Vit. B1
Vitamin B2
Vit. B2
Vitamin B3
Vit. B3
Vitamin B5
Vit. B5
Vitamin B6
Vit. B6
Vitamin B12
Vit. B12
Vitamin K
Vit. K
Folate
Folate
0%
0%
0%
0%
191%
32%
18%
81%
27%
0%
0%
42%
All nutrients comparison - raw data values
Nutrient
DV% diff.
Manganese
0.038mg
4.916mg
212%
Copper
0.021mg
0.626mg
67%
Saturated fat
15.259g
1.217g
64%
Vitamin B1
0.028mg
0.763mg
61%
Iron
0.33mg
4.72mg
55%
Vitamin B12
1.3µg
0µg
54%
Fiber
0g
10.6g
42%
Magnesium
20mg
177mg
37%
Sodium
842mg
2mg
37%
Calcium
388mg
54mg
33%
Fats
24.26g
6.9g
27%
Vitamin A
241µg
0µg
27%
Vitamin B2
0.488mg
0.139mg
27%
Selenium
14.5µg
26%
Phosphorus
347mg
523mg
25%
Cholesterol
72mg
0mg
24%
Carbs
0.46g
66.27g
22%
Zinc
2.38mg
3.97mg
14%
Monounsaturated fat
7.023g
2.178g
12%
Polyunsaturated fat
0.724g
2.535g
12%
Vitamin B6
0.227mg
0.119mg
8%
Potassium
187mg
429mg
7%
Protein
19.8g
16.89g
6%
Calories
300kcal
389kcal
4%
Choline
15.4mg
3%
Vitamin D*
18 IU
0 IU
2%
Vitamin D
0.4µg
0µg
2%
Vitamin B3
0.63mg
0.961mg
2%
Vitamin K
2µg
2%
Folate
62µg
56µg
2%
Vitamin E
0.21mg
1%
Protein per 100 calories
6.6g
4.3g
N/A
Calories per 10 g protein
152kcal
230kcal
N/A
Weight per 100 calories
33g
26g
N/A
Unsaturated / Saturated Fat ratio
0.51
3.9
N/A
Net carbs
0.46g
55.67g
N/A
Sugar
0.46g
N/A
Vitamin B5
1.364mg
1.349mg
0%
Tryptophan
0.307mg
0.234mg
0%
Threonine
0.717mg
0.575mg
0%
Isoleucine
0.968mg
0.694mg
0%
Leucine
1.84mg
1.284mg
0%
Lysine
1.766mg
0.701mg
0%
Methionine
0.565mg
0.312mg
0%
Phenylalanine
1.105mg
0.895mg
0%
Valine
1.279mg
0.937mg
0%
Histidine
0.683mg
0.405mg
0%
Macronutrient Comparison
Macronutrient breakdown side-by-side comparison
4
20%
24%
52%
4%
Protein:
19.8 g
Fats:
24.26 g
Carbs:
0.46 g
Water:
51.8 g
Other:
3.68 g
1
17%
7%
66%
8%
2%
Protein:
16.89 g
Fats:
6.9 g
Carbs:
66.27 g
Water:
8.22 g
Other:
1.72 g
Contains
more
Protein Protein
+17.2%
Contains
more
Fats Fats
+251.6%
Contains
more
Water Water
+530.2%
Contains
more
Other Other
+114%
Contains
more
Carbs Carbs
+14306.5%
Fat Type Comparison
Fat type breakdown side-by-side comparison
1
66%
31%
3%
Saturated fat:
Sat. Fat
15.259 g
Monounsaturated fat:
Mono. Fat
7.023 g
Polyunsaturated fat:
Poly. Fat
0.724 g
2
21%
37%
43%
Saturated fat:
Sat. Fat
1.217 g
Monounsaturated fat:
Mono. Fat
2.178 g
Polyunsaturated fat:
Poly. Fat
2.535 g
Contains
more
Mono. Fat Monounsaturated fat
+222.5%
Contains
less
Sat. Fat Saturated fat
-92%
Contains
more
Poly. Fat Polyunsaturated fat
+250.1%