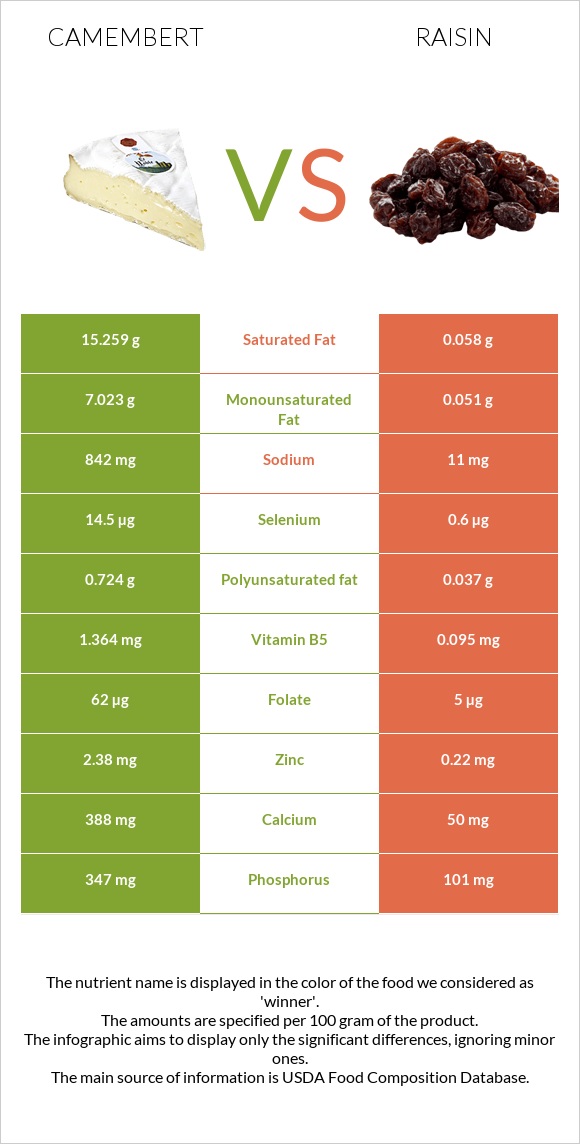
A recap on the differences between camembert and raisins Camembert is higher in vitamin B12, phosphorus, calcium, vitamin B2, vitamin B5, and selenium, yet raisins are higher in copper. Camembert covers your daily saturated fat needs 76% more than raisins. The amount of cholesterol in raisins is lower. The glycemic index of camembert is lower. Food varieties used in this article are Cheese, camembert and Raisins, seedless .
Infographic
Mineral Comparison
Mineral comparison score is based on the number of minerals by which one or the other food is richer. The "coverage" charts below show how much of the daily needs can be covered by 300 grams of the food.
4
100 g
300 g
1 cubic inch - 17g 1 oz - 28.35g 1 wedge (1.33 oz) - 38g 1 cup - 246g
Magnesium
Magnesium
Calcium
Calcium
Potassium
Potassium
Iron
Iron
Copper
Copper
Zinc
Zinc
Phosphorus
Phosphorus
Sodium
Sodium
Manganese
Manganese
Selenium
Selenium
14%
116%
17%
12%
7%
65%
149%
110%
5%
79%
6
100 g
300 g
1 miniature box (.5 oz) - 14g 50 raisins - 26g 1 oz (60 raisins) - 28.35g 1 small box (1.5 oz) - 43g 1 cup (not packed) - 145g 1 cup, packed - 165g
Magnesium
Magnesium
Calcium
Calcium
Potassium
Potassium
Iron
Iron
Copper
Copper
Zinc
Zinc
Phosphorus
Phosphorus
Sodium
Sodium
Manganese
Manganese
Selenium
Selenium
23%
15%
66%
71%
106%
6%
43%
1.4%
39%
3.3%
Vitamin Comparison
Vitamin comparison score is based on the number of vitamins by which one or the other food is richer. The "coverage" charts below show how much of the daily needs can be covered by 300 grams of the food.
8
100 g
300 g
1 cubic inch - 17g 1 oz - 28.35g 1 wedge (1.33 oz) - 38g 1 cup - 246g
Vitamin C
Vit. C
Vitamin D
Vit. D
Vitamin A
Vit. A
Vitamin E
Vit. E
Vitamin B1
Vit. B1
Vitamin B2
Vit. B2
Vitamin B3
Vit. B3
Vitamin B5
Vit. B5
Vitamin B6
Vit. B6
Vitamin B12
Vit. B12
Vitamin K
Vit. K
Folate
Folate
0%
6%
80%
4.2%
7%
113%
12%
82%
52%
163%
5%
47%
4
100 g
300 g
1 miniature box (.5 oz) - 14g 50 raisins - 26g 1 oz (60 raisins) - 28.35g 1 small box (1.5 oz) - 43g 1 cup (not packed) - 145g 1 cup, packed - 165g
Vitamin C
Vit. C
Vitamin D
Vit. D
Vitamin A
Vit. A
Vitamin E
Vit. E
Vitamin B1
Vit. B1
Vitamin B2
Vit. B2
Vitamin B3
Vit. B3
Vitamin B5
Vit. B5
Vitamin B6
Vit. B6
Vitamin B12
Vit. B12
Vitamin K
Vit. K
Folate
Folate
7.7%
0%
0%
2.4%
27%
29%
14%
5.7%
40%
0%
8.8%
3.8%
All nutrients comparison - raw data values
Nutrient
DV% diff.
Saturated fat
15.259g
0.058g
69%
Vitamin B12
1.3µg
0µg
54%
Fats
24.26g
0.46g
37%
Fructose
29.68g
37%
Sodium
842mg
11mg
36%
Phosphorus
347mg
101mg
35%
Calcium
388mg
50mg
34%
Protein
19.8g
3.07g
33%
Copper
0.021mg
0.318mg
33%
Vitamin B2
0.488mg
0.125mg
28%
Vitamin A
241µg
0µg
27%
Carbs
0.46g
79.18g
26%
Selenium
14.5µg
0.6µg
25%
Vitamin B5
1.364mg
0.095mg
25%
Cholesterol
72mg
0mg
24%
Zinc
2.38mg
0.22mg
20%
Iron
0.33mg
1.88mg
19%
Potassium
187mg
749mg
17%
Monounsaturated fat
7.023g
0.051g
17%
Fiber
0g
3.7g
15%
Folate
62µg
5µg
14%
Manganese
0.038mg
0.299mg
11%
Vitamin B1
0.028mg
0.106mg
7%
Polyunsaturated fat
0.724g
0.037g
5%
Vitamin B6
0.227mg
0.174mg
4%
Vitamin C
0mg
2.3mg
3%
Magnesium
20mg
32mg
3%
Vitamin D*
18 IU
0 IU
2%
Vitamin D
0.4µg
0µg
2%
Starch
2.7g
1%
Vitamin E
0.21mg
0.12mg
1%
Vitamin B3
0.63mg
0.766mg
1%
Vitamin K
2µg
3.5µg
1%
Choline
15.4mg
11.1mg
1%
Calories
300kcal
299kcal
0%
Protein per 100 calories
6.6g
1g
N/A
Calories per 10 g protein
152kcal
974kcal
N/A
Weight per 100 calories
33g
33g
N/A
Unsaturated / Saturated Fat ratio
0.51
1.5
N/A
Net carbs
0.46g
75.48g
N/A
Sugar
0.46g
59.19g
N/A
Tryptophan
0.307mg
0.05mg
0%
Threonine
0.717mg
0.077mg
0%
Isoleucine
0.968mg
0.057mg
0%
Leucine
1.84mg
0.096mg
0%
Lysine
1.766mg
0.084mg
0%
Methionine
0.565mg
0.021mg
0%
Phenylalanine
1.105mg
0.065mg
0%
Valine
1.279mg
0.083mg
0%
Histidine
0.683mg
0.072mg
0%
Omega-6 - Gamma-linoleic acid
0.001g
N/A
Macronutrient Comparison
Macronutrient breakdown side-by-side comparison
4
20%
24%
52%
4%
Protein:
19.8 g
Fats:
24.26 g
Carbs:
0.46 g
Water:
51.8 g
Other:
3.68 g
1
3%
79%
15%
2%
Protein:
3.07 g
Fats:
0.46 g
Carbs:
79.18 g
Water:
15.43 g
Other:
1.86 g
Contains
more
Protein Protein
+545%
Contains
more
Fats Fats
+5173.9%
Contains
more
Water Water
+235.7%
Contains
more
Other Other
+97.8%
Contains
more
Carbs Carbs
+17113%
Fat Type Comparison
Fat type breakdown side-by-side comparison
2
66%
31%
3%
Saturated fat:
Sat. Fat
15.259 g
Monounsaturated fat:
Mono. Fat
7.023 g
Polyunsaturated fat:
Poly. Fat
0.724 g
1
40%
35%
25%
Saturated fat:
Sat. Fat
0.058 g
Monounsaturated fat:
Mono. Fat
0.051 g
Polyunsaturated fat:
Poly. Fat
0.037 g
Contains
more
Mono. Fat Monounsaturated fat
+13670.6%
Contains
more
Poly. Fat Polyunsaturated fat
+1856.8%
Contains
less
Sat. Fat Saturated fat
-99.6%