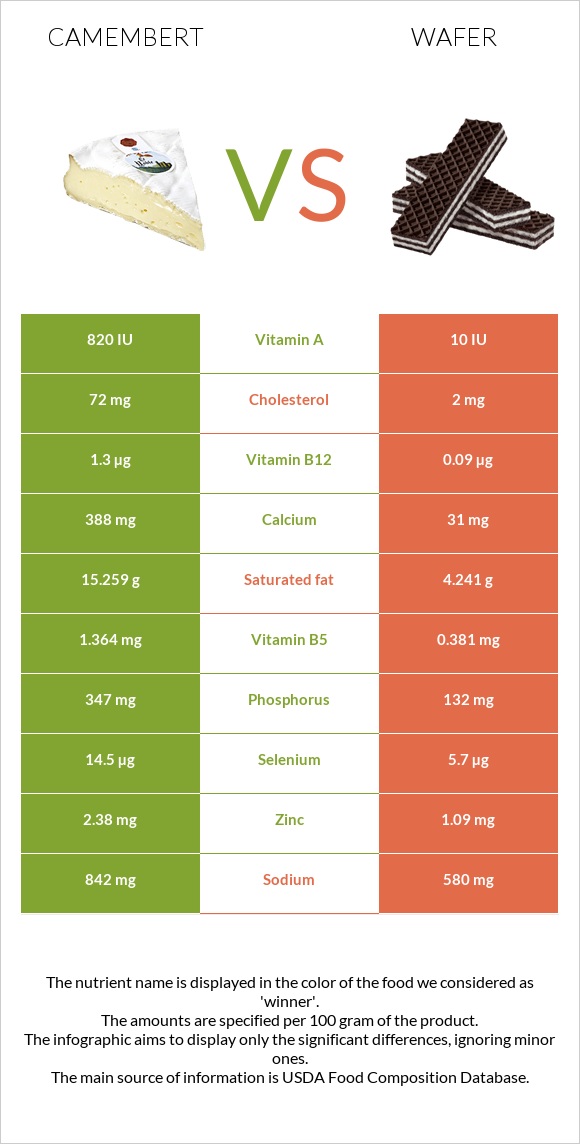
The main differences between camembert and wafer Camembert is richer in vitamin B12, calcium, phosphorus, vitamin B5, and vitamin B2, yet wafer is richer in copper, iron, and manganese. Daily need coverage for saturated fat for camembert is 55% higher. Camembert contains 36 times more cholesterol than wafer. Camembert contains 72mg of cholesterol, while wafer contains 2mg. Camembert has a lower glycemic index than wafer. Food types used in this article are Cheese, camembert and Cookies, chocolate wafers .
Infographic
Mineral Comparison
Mineral comparison score is based on the number of minerals by which one or the other food is richer. The "coverage" charts below show how much of the daily needs can be covered by 300 grams of the food.
4
100 g
300 g
1 cubic inch - 17g 1 oz - 28.35g 1 wedge (1.33 oz) - 38g 1 cup - 246g
Magnesium
Magnesium
Calcium
Calcium
Potassium
Potassium
Iron
Iron
Copper
Copper
Zinc
Zinc
Phosphorus
Phosphorus
Sodium
Sodium
Manganese
Manganese
Selenium
Selenium
14%
116%
17%
12%
7%
65%
149%
110%
5%
79%
6
100 g
300 g
1 wafer - 6g 1 oz - 28.35g 1 cup, crumbs - 112g
Magnesium
Magnesium
Calcium
Calcium
Potassium
Potassium
Iron
Iron
Copper
Copper
Zinc
Zinc
Phosphorus
Phosphorus
Sodium
Sodium
Manganese
Manganese
Selenium
Selenium
38%
9.3%
19%
150%
154%
30%
57%
76%
91%
31%
Vitamin Comparison
Vitamin comparison score is based on the number of vitamins by which one or the other food is richer. The "coverage" charts below show how much of the daily needs can be covered by 300 grams of the food.
7
100 g
300 g
1 cubic inch - 17g 1 oz - 28.35g 1 wedge (1.33 oz) - 38g 1 cup - 246g
Vitamin C
Vit. C
Vitamin D
Vit. D
Vitamin A
Vit. A
Vitamin E
Vit. E
Vitamin B1
Vit. B1
Vitamin B2
Vit. B2
Vitamin B3
Vit. B3
Vitamin B5
Vit. B5
Vitamin B6
Vit. B6
Vitamin B12
Vit. B12
Vitamin K
Vit. K
Folate
Folate
0%
6%
80%
4.2%
7%
113%
12%
82%
52%
163%
5%
47%
4
100 g
300 g
1 wafer - 6g 1 oz - 28.35g 1 cup, crumbs - 112g
Vitamin C
Vit. C
Vitamin D
Vit. D
Vitamin A
Vit. A
Vitamin E
Vit. E
Vitamin B1
Vit. B1
Vitamin B2
Vit. B2
Vitamin B3
Vit. B3
Vitamin B5
Vit. B5
Vitamin B6
Vit. B6
Vitamin B12
Vit. B12
Vitamin K
Vit. K
Folate
Folate
0%
0%
1%
14%
51%
61%
54%
23%
12%
11%
6%
35%
All nutrients comparison - raw data values
Nutrient
DV% diff.
Vitamin B12
1.3µg
0.09µg
50%
Saturated fat
15.259g
4.241g
50%
Copper
0.021mg
0.463mg
49%
Iron
0.33mg
4.01mg
46%
Calcium
388mg
31mg
36%
Phosphorus
347mg
132mg
31%
Manganese
0.038mg
0.696mg
29%
Protein
19.8g
6.6g
26%
Vitamin A
241µg
3µg
26%
Carbs
0.46g
72.7g
24%
Cholesterol
72mg
2mg
23%
Polyunsaturated fat
0.724g
4.153g
23%
Vitamin B5
1.364mg
0.381mg
20%
Vitamin B2
0.488mg
0.266mg
17%
Selenium
14.5µg
5.7µg
16%
Fats
24.26g
14.2g
15%
Vitamin B1
0.028mg
0.203mg
15%
Fiber
0g
3.4g
14%
Vitamin B3
0.63mg
2.858mg
14%
Vitamin B6
0.227mg
0.051mg
14%
Zinc
2.38mg
1.09mg
12%
Sodium
842mg
580mg
11%
Magnesium
20mg
53mg
8%
Calories
300kcal
433kcal
7%
Monounsaturated fat
7.023g
4.865g
5%
Folate
62µg
47µg
4%
Vitamin E
0.21mg
0.72mg
3%
Caffeine
0mg
10mg
3%
Vitamin D*
18 IU
0 IU
2%
Vitamin D
0.4µg
0µg
2%
Potassium
187mg
210mg
1%
Protein per 100 calories
6.6g
1.5g
N/A
Calories per 10 g protein
152kcal
656kcal
N/A
Weight per 100 calories
33g
23g
N/A
Unsaturated / Saturated Fat ratio
0.51
2.1
N/A
Net carbs
0.46g
69.3g
N/A
Sugar
0.46g
37.43g
N/A
Vitamin K
2µg
2.4µg
0%
Choline
15.4mg
14.3mg
0%
Tryptophan
0.307mg
0.096mg
0%
Threonine
0.717mg
0.22mg
0%
Isoleucine
0.968mg
0.261mg
0%
Leucine
1.84mg
0.447mg
0%
Lysine
1.766mg
0.281mg
0%
Methionine
0.565mg
0.105mg
0%
Phenylalanine
1.105mg
0.308mg
0%
Valine
1.279mg
0.323mg
0%
Histidine
0.683mg
0.128mg
0%
Omega-3 - EPA
0g
0.003g
N/A
Omega-3 - DHA
0g
0.002g
N/A
Macronutrient Comparison
Macronutrient breakdown side-by-side comparison
4
20%
24%
52%
4%
Protein:
19.8 g
Fats:
24.26 g
Carbs:
0.46 g
Water:
51.8 g
Other:
3.68 g
1
7%
14%
73%
5%
2%
Protein:
6.6 g
Fats:
14.2 g
Carbs:
72.7 g
Water:
4.5 g
Other:
2 g
Contains
more
Protein Protein
+200%
Contains
more
Fats Fats
+70.8%
Contains
more
Water Water
+1051.1%
Contains
more
Other Other
+84%
Contains
more
Carbs Carbs
+15704.3%
Fat Type Comparison
Fat type breakdown side-by-side comparison
1
66%
31%
3%
Saturated fat:
Sat. Fat
15.259 g
Monounsaturated fat:
Mono. Fat
7.023 g
Polyunsaturated fat:
Poly. Fat
0.724 g
2
32%
37%
31%
Saturated fat:
Sat. Fat
4.241 g
Monounsaturated fat:
Mono. Fat
4.865 g
Polyunsaturated fat:
Poly. Fat
4.153 g
Contains
more
Mono. Fat Monounsaturated fat
+44.4%
Contains
less
Sat. Fat Saturated fat
-72.2%
Contains
more
Poly. Fat Polyunsaturated fat
+473.6%