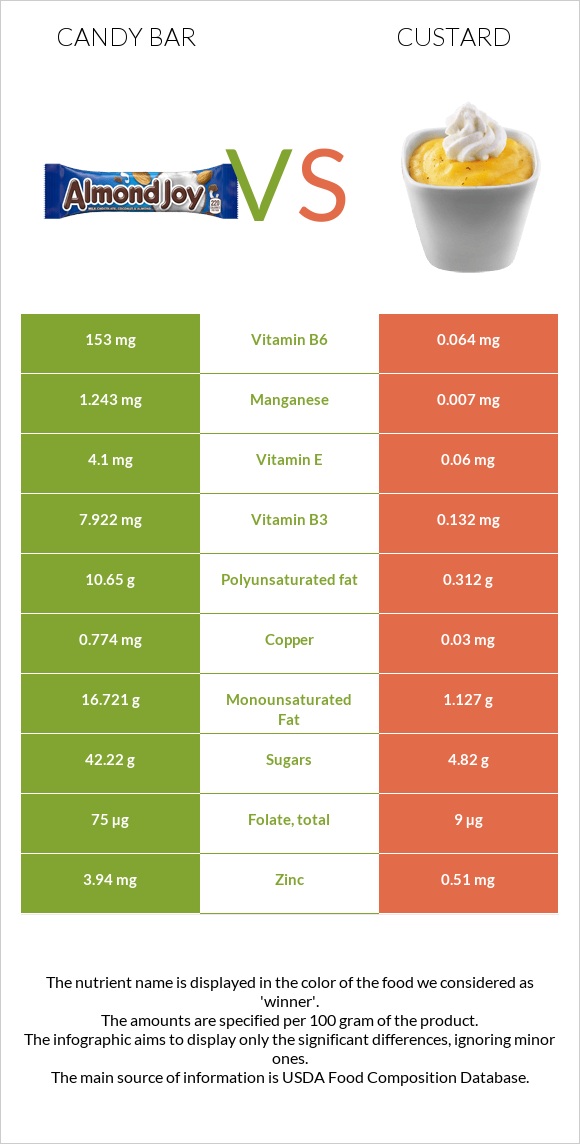
What are the differences between candy bar and custard? Candy bar is higher in vitamin B6, copper, manganese, vitamin B3, zinc, vitamin E, phosphorus, and magnesium, yet custard is higher in vitamin B12. Candy bar's daily need coverage for vitamin B6 is 11764% more. Candy bar has 178 times more manganese than custard. While candy bar has 1.243mg of manganese, custard has only 0.007mg. The glycemic index of custard is lower. We used Candies, peanut bar and Egg custards, dry mix, prepared with whole milk types in this article.
Infographic
Mineral Comparison
Mineral comparison score is based on the number of minerals by which one or the other food is richer. The "coverage" charts below show how much of the daily needs can be covered by 300 grams of the food.
7
100 g
300 g
1 oz - 28.35g 1 bar (1.4 oz) - 40g 1 bar (1.6 oz) - 45g 1 bar (1.75 fl oz) - 50g
Magnesium
Magnesium
Calcium
Calcium
Potassium
Potassium
Iron
Iron
Copper
Copper
Zinc
Zinc
Phosphorus
Phosphorus
Sodium
Sodium
Manganese
Manganese
Selenium
Selenium
79%
23%
36%
36%
258%
107%
132%
20%
162%
26%
3
100 g
300 g
0.5 cup - 141g
Magnesium
Magnesium
Calcium
Calcium
Potassium
Potassium
Iron
Iron
Copper
Copper
Zinc
Zinc
Phosphorus
Phosphorus
Sodium
Sodium
Manganese
Manganese
Selenium
Selenium
11%
42%
18%
13%
10%
14%
56%
11%
0.91%
33%
Vitamin Comparison
Vitamin comparison score is based on the number of vitamins by which one or the other food is richer. The "coverage" charts below show how much of the daily needs can be covered by 300 grams of the food.
6
100 g
300 g
1 oz - 28.35g 1 bar (1.4 oz) - 40g 1 bar (1.6 oz) - 45g 1 bar (1.75 fl oz) - 50g
Vitamin C
Vit. C
Vitamin D
Vit. D
Vitamin A
Vit. A
Vitamin E
Vit. E
Vitamin B1
Vit. B1
Vitamin B2
Vit. B2
Vitamin B3
Vit. B3
Vitamin B5
Vit. B5
Vitamin B6
Vit. B6
Vitamin B12
Vit. B12
Vitamin K
Vit. K
Folate
Folate
0%
0%
0%
82%
25%
32%
149%
50%
35308%
0%
0%
56%
6
100 g
300 g
0.5 cup - 141g
Vitamin C
Vit. C
Vitamin D
Vit. D
Vitamin A
Vit. A
Vitamin E
Vit. E
Vitamin B1
Vit. B1
Vitamin B2
Vit. B2
Vitamin B3
Vit. B3
Vitamin B5
Vit. B5
Vitamin B6
Vit. B6
Vitamin B12
Vit. B12
Vitamin K
Vit. K
Folate
Folate
0.33%
18%
17%
1.2%
15%
51%
2.5%
42%
15%
65%
0.5%
6.8%
All nutrients comparison - raw data values
Nutrient
DV% diff.
Vitamin B6
153mg
0.064mg
11764%
Copper
0.774mg
0.03mg
83%
Polyunsaturated fat
10.65g
0.312g
69%
Manganese
1.243mg
0.007mg
54%
Vitamin B3
7.922mg
0.132mg
49%
Fats
33.7g
4g
46%
Monounsaturated fat
16.721g
1.127g
39%
Zinc
3.94mg
0.51mg
31%
Vitamin E
4.1mg
0.06mg
27%
Phosphorus
308mg
130mg
25%
Protein
15.5g
3.99g
23%
Magnesium
110mg
16mg
22%
Vitamin B12
0µg
0.52µg
22%
Calories
522kcal
122kcal
20%
Cholesterol
0mg
51mg
17%
Folate
75µg
9µg
17%
Fiber
4.1g
0g
16%
Saturated fat
4.678g
2.032g
12%
Carbs
47.4g
17.6g
10%
Iron
0.97mg
0.34mg
8%
Vitamin D*
0 IU
47 IU
6%
Vitamin D
0µg
1.2µg
6%
Calcium
78mg
139mg
6%
Potassium
407mg
207mg
6%
Vitamin A
0µg
52µg
6%
Vitamin B2
0.14mg
0.22mg
6%
Sodium
156mg
84mg
3%
Vitamin B1
0.1mg
0.061mg
3%
Vitamin B5
0.83mg
0.699mg
3%
Choline
29.4mg
11.8mg
3%
Selenium
4.7µg
6µg
2%
Protein per 100 calories
3g
3.3g
N/A
Calories per 10 g protein
337kcal
306kcal
N/A
Weight per 100 calories
19g
82g
N/A
Unsaturated / Saturated Fat ratio
5.9
0.71
N/A
Vitamin C
0mg
0.1mg
0%
Net carbs
43.3g
17.6g
N/A
Sugar
42.22g
4.82g
N/A
Vitamin K
0µg
0.2µg
0%
Tryptophan
0.149mg
0.082mg
0%
Threonine
0.52mg
0.192mg
0%
Isoleucine
0.534mg
0.207mg
0%
Leucine
0.986mg
0.337mg
0%
Lysine
0.545mg
0.214mg
0%
Methionine
0.185mg
0.091mg
0%
Phenylalanine
0.787mg
0.173mg
0%
Valine
0.638mg
0.233mg
0%
Histidine
0.385mg
0.092mg
0%
Omega-3 - DHA
0g
0.003g
N/A
Macronutrient Comparison
Macronutrient breakdown side-by-side comparison
4
16%
34%
47%
2%
Protein:
15.5 g
Fats:
33.7 g
Carbs:
47.4 g
Water:
1.6 g
Other:
1.8 g
1
4%
4%
18%
73%
Protein:
3.99 g
Fats:
4 g
Carbs:
17.6 g
Water:
73.45 g
Other:
0.96 g
Contains
more
Protein Protein
+288.5%
Contains
more
Fats Fats
+742.5%
Contains
more
Carbs Carbs
+169.3%
Contains
more
Other Other
+87.5%
Contains
more
Water Water
+4490.6%
Fat Type Comparison
Fat type breakdown side-by-side comparison
2
15%
52%
33%
Saturated fat:
Sat. Fat
4.678 g
Monounsaturated fat:
Mono. Fat
16.721 g
Polyunsaturated fat:
Poly. Fat
10.65 g
1
59%
32%
9%
Saturated fat:
Sat. Fat
2.032 g
Monounsaturated fat:
Mono. Fat
1.127 g
Polyunsaturated fat:
Poly. Fat
0.312 g
Contains
more
Mono. Fat Monounsaturated fat
+1383.7%
Contains
more
Poly. Fat Polyunsaturated fat
+3313.5%
Contains
less
Sat. Fat Saturated fat
-56.6%