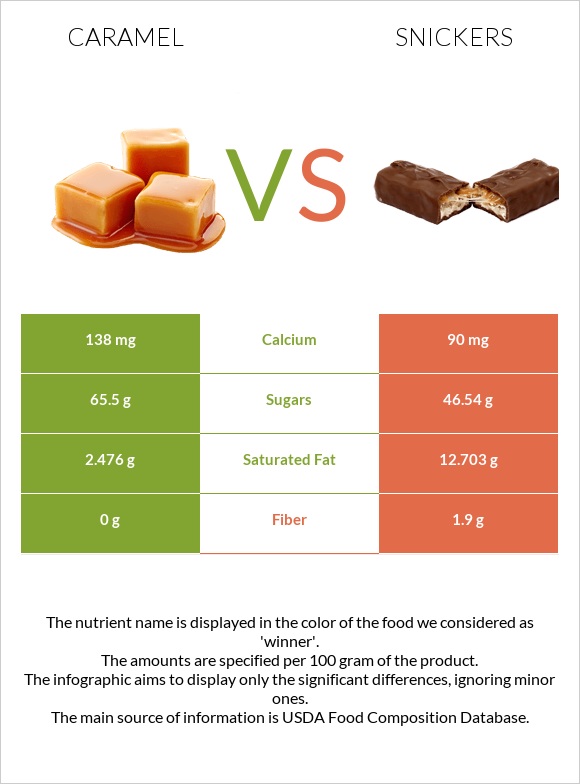
Summary of differences between caramel and snickers Caramel has less fiber and iron than snickers. Snickers covers your daily need for saturated fat, 51% more than caramel. Caramel has 2 times more calcium than snickers. While caramel has 138mg of calcium, snickers has only 90mg. Snickers has less sugar. The glycemic index of caramel is higher. These are the specific foods used in this comparison Candies, caramels and Candies, MARS SNACKFOOD US, SNICKERS CRUNCHER .
Infographic
Mineral Comparison
Mineral comparison score is based on the number of minerals by which one or the other food is richer. The "coverage" charts below show how much of the daily needs can be covered by 300 grams of the food.
8
100 g
300 g
1 piece - 10.1g 1 package (2.5 oz) - 71g
Magnesium
Magnesium
Calcium
Calcium
Potassium
Potassium
Iron
Iron
Copper
Copper
Zinc
Zinc
Phosphorus
Phosphorus
Sodium
Sodium
Manganese
Manganese
Selenium
Selenium
12%
41%
19%
5.3%
6%
12%
49%
32%
1.4%
9.8%
2
100 g
300 g
1 bar fun size - 15g 1 serving 1.56 oz bar - 44g 1 serving 1.66 oz bar - 47g
Magnesium
Magnesium
Calcium
Calcium
Potassium
Potassium
Iron
Iron
Copper
Copper
Zinc
Zinc
Phosphorus
Phosphorus
Sodium
Sodium
Manganese
Manganese
Selenium
Selenium
0%
27%
0%
26%
0%
0%
0%
25%
0%
0%
Vitamin Comparison
Vitamin comparison score is based on the number of vitamins by which one or the other food is richer. The "coverage" charts below show how much of the daily needs can be covered by 300 grams of the food.
10
100 g
300 g
1 piece - 10.1g 1 package (2.5 oz) - 71g
Vitamin C
Vit. C
Vitamin D
Vit. D
Vitamin A
Vit. A
Vitamin E
Vit. E
Vitamin B1
Vit. B1
Vitamin B2
Vit. B2
Vitamin B3
Vit. B3
Vitamin B5
Vit. B5
Vitamin B6
Vit. B6
Vitamin B12
Vit. B12
Vitamin K
Vit. K
Folate
Folate
1.3%
0%
4%
9.2%
26%
59%
2.8%
37%
13%
38%
4.5%
3%
1
100 g
300 g
1 bar fun size - 15g 1 serving 1.56 oz bar - 44g 1 serving 1.66 oz bar - 47g
Vitamin C
Vit. C
Vitamin D
Vit. D
Vitamin A
Vit. A
Vitamin E
Vit. E
Vitamin B1
Vit. B1
Vitamin B2
Vit. B2
Vitamin B3
Vit. B3
Vitamin B5
Vit. B5
Vitamin B6
Vit. B6
Vitamin B12
Vit. B12
Vitamin K
Vit. K
Folate
Folate
1.7%
0%
0%
0%
0%
0%
0%
0%
0%
0%
0%
0%
All nutrients comparison - raw data values
Nutrient
DV% diff.
Saturated fat
2.476g
12.703g
46%
Fats
8.1g
24.38g
25%
Polyunsaturated fat
3.478g
23%
Vitamin B2
0.256mg
20%
Phosphorus
114mg
16%
Vitamin B12
0.3µg
13%
Vitamin B5
0.62mg
12%
Vitamin B1
0.103mg
9%
Fiber
0g
1.9g
8%
Iron
0.14mg
0.68mg
7%
Potassium
214mg
6%
Calories
382kcal
488kcal
5%
Protein
4.6g
6.86g
5%
Carbs
77g
62.85g
5%
Calcium
138mg
90mg
5%
Magnesium
17mg
4%
Zinc
0.44mg
4%
Vitamin B6
0.056mg
4%
Monounsaturated fat
1.542g
4%
Vitamin E
0.46mg
3%
Selenium
1.8µg
3%
Copper
0.018mg
2%
Sodium
245mg
189mg
2%
Vitamin K
1.8µg
2%
Cholesterol
7mg
9mg
1%
Vitamin A
12µg
1%
Vitamin B3
0.148mg
1%
Folate
4µg
1%
Choline
8mg
1%
Protein per 100 calories
1.2g
1.4g
N/A
Calories per 10 g protein
830kcal
711kcal
N/A
Weight per 100 calories
26g
20g
N/A
Unsaturated / Saturated Fat ratio
2
0
N/A
Vitamin C
0.4mg
0.5mg
0%
Net carbs
77g
60.95g
N/A
Sugar
65.5g
46.54g
N/A
Manganese
0.011mg
0%
Trans fat
0.394g
N/A
Tryptophan
0.06mg
0%
Threonine
0.192mg
0%
Isoleucine
0.258mg
0%
Leucine
0.417mg
0%
Lysine
0.338mg
0%
Methionine
0.107mg
0%
Phenylalanine
0.205mg
0%
Valine
0.285mg
0%
Histidine
0.115mg
0%
Macronutrient Comparison
Macronutrient breakdown side-by-side comparison
3
5%
8%
77%
9%
2%
Protein:
4.6 g
Fats:
8.1 g
Carbs:
77 g
Water:
8.5 g
Other:
1.8 g
2
7%
24%
63%
4%
Protein:
6.86 g
Fats:
24.38 g
Carbs:
62.85 g
Water:
4.47 g
Other:
1.44 g
Contains
more
Carbs Carbs
+22.5%
Contains
more
Water Water
+90.2%
Contains
more
Other Other
+25%
Contains
more
Protein Protein
+49.1%
Contains
more
Fats Fats
+201%
Fat Type Comparison
Fat type breakdown side-by-side comparison
3
33%
21%
46%
Saturated fat:
Sat. Fat
2.476 g
Monounsaturated fat:
Mono. Fat
1.542 g
Polyunsaturated fat:
Poly. Fat
3.478 g
0
100%
Saturated fat:
Sat. Fat
12.703 g
Monounsaturated fat:
Mono. Fat
0 g
Polyunsaturated fat:
Poly. Fat
0 g
Contains
less
Sat. Fat Saturated fat
-80.5%
Contains
more
Mono. Fat Monounsaturated fat
+∞%
Contains
more
Poly. Fat Polyunsaturated fat
+∞%