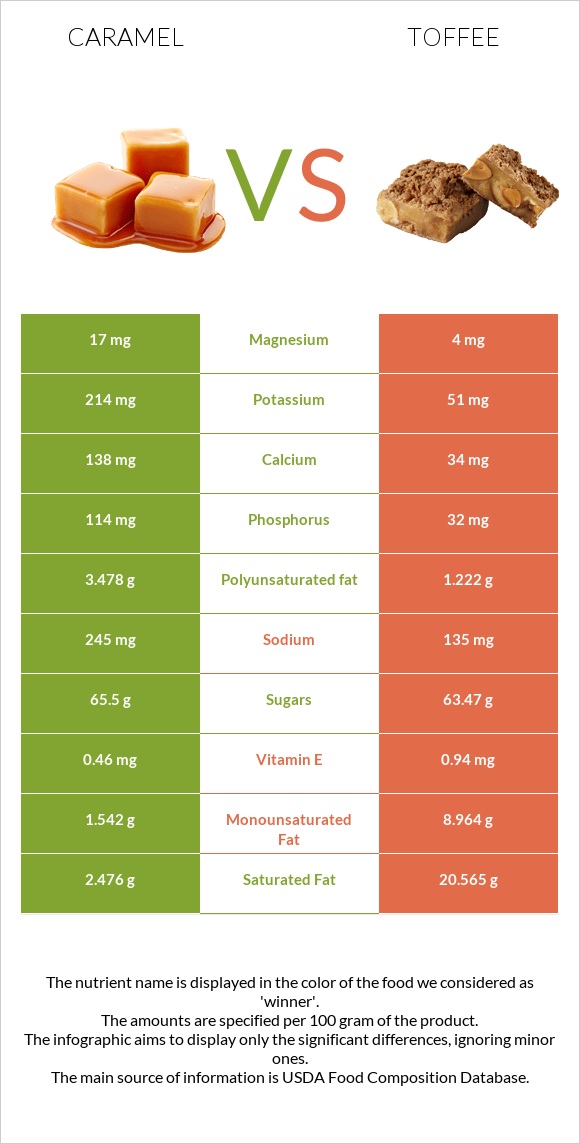
What are the differences between caramel and toffee? Caramel is higher in vitamin B2, phosphorus, calcium, vitamin B5, vitamin B12, and vitamin B1, yet toffee is higher in vitamin A. Toffee's daily need coverage for saturated fat is 90% more. Caramel has 13 times more vitamin B1 than toffee. While caramel has 0.103mg of vitamin B1, toffee has only 0.008mg. The amount of saturated fat in caramel is lower. The glycemic index of toffee is lower. We used Candies, caramels and Candies, toffee, prepared-from-recipe types in this article.
Infographic
Mineral Comparison
Mineral comparison score is based on the number of minerals by which one or the other food is richer. The "coverage" charts below show how much of the daily needs can be covered by 300 grams of the food.
9
100 g
300 g
1 piece - 10.1g 1 package (2.5 oz) - 71g
Magnesium
Magnesium
Calcium
Calcium
Potassium
Potassium
Iron
Iron
Copper
Copper
Zinc
Zinc
Phosphorus
Phosphorus
Sodium
Sodium
Manganese
Manganese
Selenium
Selenium
12%
41%
19%
5.3%
6%
12%
49%
32%
1.4%
9.8%
1
100 g
300 g
1 piece - 12g
Magnesium
Magnesium
Calcium
Calcium
Potassium
Potassium
Iron
Iron
Copper
Copper
Zinc
Zinc
Phosphorus
Phosphorus
Sodium
Sodium
Manganese
Manganese
Selenium
Selenium
2.9%
10%
4.5%
1.1%
1%
3.3%
14%
18%
0.26%
4.4%
Vitamin Comparison
Vitamin comparison score is based on the number of vitamins by which one or the other food is richer. The "coverage" charts below show how much of the daily needs can be covered by 300 grams of the food.
8
100 g
300 g
1 piece - 10.1g 1 package (2.5 oz) - 71g
Vitamin C
Vit. C
Vitamin D
Vit. D
Vitamin A
Vit. A
Vitamin E
Vit. E
Vitamin B1
Vit. B1
Vitamin B2
Vit. B2
Vitamin B3
Vit. B3
Vitamin B5
Vit. B5
Vitamin B6
Vit. B6
Vitamin B12
Vit. B12
Vitamin K
Vit. K
Folate
Folate
1.3%
0%
4%
9.2%
26%
59%
2.8%
37%
13%
38%
4.5%
3%
3
100 g
300 g
1 piece - 12g
Vitamin C
Vit. C
Vitamin D
Vit. D
Vitamin A
Vit. A
Vitamin E
Vit. E
Vitamin B1
Vit. B1
Vitamin B2
Vit. B2
Vitamin B3
Vit. B3
Vitamin B5
Vit. B5
Vitamin B6
Vit. B6
Vitamin B12
Vit. B12
Vitamin K
Vit. K
Folate
Folate
0.67%
0%
106%
19%
2%
16%
0.54%
8%
2.1%
14%
7%
1.5%
All nutrients comparison - raw data values
Nutrient
DV% diff.
Saturated fat
2.476g
20.565g
82%
Fats
8.1g
32.75g
38%
Vitamin A
12µg
319µg
34%
Cholesterol
7mg
104mg
32%
Monounsaturated fat
1.542g
8.964g
19%
Polyunsaturated fat
3.478g
1.222g
15%
Vitamin B2
0.256mg
0.068mg
14%
Phosphorus
114mg
32mg
12%
Calcium
138mg
34mg
10%
Vitamin B5
0.62mg
0.134mg
10%
Calories
382kcal
560kcal
9%
Vitamin B1
0.103mg
0.008mg
8%
Vitamin B12
0.3µg
0.11µg
8%
Protein
4.6g
1.07g
7%
Potassium
214mg
51mg
5%
Sodium
245mg
135mg
5%
Carbs
77g
64.72g
4%
Vitamin B6
0.056mg
0.009mg
4%
Magnesium
17mg
4mg
3%
Zinc
0.44mg
0.12mg
3%
Vitamin E
0.46mg
0.94mg
3%
Copper
0.018mg
0.003mg
2%
Selenium
1.8µg
0.8µg
2%
Iron
0.14mg
0.03mg
1%
Vitamin B3
0.148mg
0.029mg
1%
Vitamin K
1.8µg
2.8µg
1%
Folate
4µg
2µg
1%
Choline
8mg
1%
Protein per 100 calories
1.2g
0.19g
N/A
Calories per 10 g protein
830kcal
5234kcal
N/A
Weight per 100 calories
26g
18g
N/A
Unsaturated / Saturated Fat ratio
2
0.5
N/A
Vitamin C
0.4mg
0.2mg
0%
Net carbs
77g
64.72g
N/A
Sugar
65.5g
63.47g
N/A
Manganese
0.011mg
0.002mg
0%
Trans fat
0.674g
N/A
Tryptophan
0.06mg
0%
Threonine
0.192mg
0%
Isoleucine
0.258mg
0%
Leucine
0.417mg
0%
Lysine
0.338mg
0%
Methionine
0.107mg
0%
Phenylalanine
0.205mg
0%
Valine
0.285mg
0%
Histidine
0.115mg
0%
Omega-3 - ALA
0.065g
N/A
Omega-6 - Linoleic acid
0.445g
N/A
Macronutrient Comparison
Macronutrient breakdown side-by-side comparison
4
5%
8%
77%
9%
2%
Protein:
4.6 g
Fats:
8.1 g
Carbs:
77 g
Water:
8.5 g
Other:
1.8 g
1
33%
65%
Protein:
1.07 g
Fats:
32.75 g
Carbs:
64.72 g
Water:
0.55 g
Other:
0.91 g
Contains
more
Protein Protein
+329.9%
Contains
more
Carbs Carbs
+19%
Contains
more
Water Water
+1445.5%
Contains
more
Other Other
+97.8%
Contains
more
Fats Fats
+304.3%
Fat Type Comparison
Fat type breakdown side-by-side comparison
2
33%
21%
46%
Saturated fat:
Sat. Fat
2.476 g
Monounsaturated fat:
Mono. Fat
1.542 g
Polyunsaturated fat:
Poly. Fat
3.478 g
1
67%
29%
4%
Saturated fat:
Sat. Fat
20.565 g
Monounsaturated fat:
Mono. Fat
8.964 g
Polyunsaturated fat:
Poly. Fat
1.222 g
Contains
less
Sat. Fat Saturated fat
-88%
Contains
more
Poly. Fat Polyunsaturated fat
+184.6%
Contains
more
Mono. Fat Monounsaturated fat
+481.3%