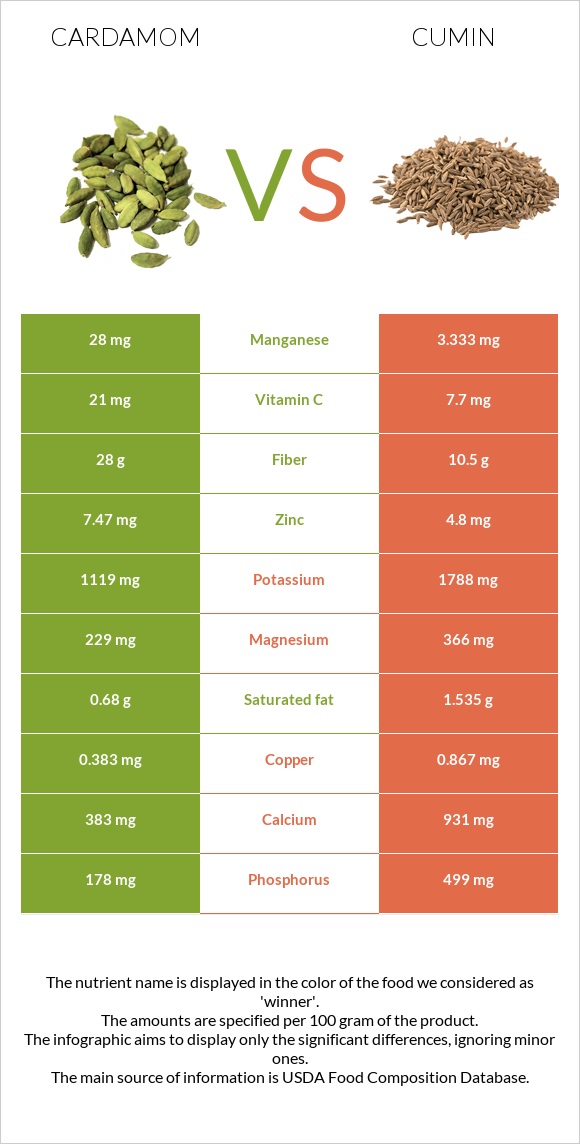
Significant differences between cardamom and cumin Cardamom has more manganese, fiber, and zinc; however, cumin is richer in iron, calcium, copper, phosphorus, vitamin B1, magnesium, and vitamin A. Cardamom covers your daily manganese needs 1072% more than cumin. Cumin has 3 times less fiber than cardamom. Cardamom has 28g of fiber, while cumin has 10.5g. Specific food types used in this comparison are Spices, cardamom and Spices, cumin seed .
Infographic
Mineral Comparison
Mineral comparison score is based on the number of minerals by which one or the other food is richer. The "coverage" charts below show how much of the daily needs can be covered by 300 grams of the food.
3
100 g
300 g
1 tsp, ground - 2g 1 tbsp, ground - 5.8g
Magnesium
Magnesium
Calcium
Calcium
Potassium
Potassium
Iron
Iron
Copper
Copper
Zinc
Zinc
Phosphorus
Phosphorus
Sodium
Sodium
Manganese
Manganese
Selenium
Selenium
164%
115%
99%
524%
128%
204%
76%
2.3%
3652%
0%
7
100 g
300 g
0.25 tsp, whole - 0.5g 1 tbsp, whole - 6g
Magnesium
Magnesium
Calcium
Calcium
Potassium
Potassium
Iron
Iron
Copper
Copper
Zinc
Zinc
Phosphorus
Phosphorus
Sodium
Sodium
Manganese
Manganese
Selenium
Selenium
261%
279%
158%
2489%
289%
131%
214%
22%
435%
28%
Vitamin Comparison
Vitamin comparison score is based on the number of vitamins by which one or the other food is richer. The "coverage" charts below show how much of the daily needs can be covered by 300 grams of the food.
1
100 g
300 g
1 tsp, ground - 2g 1 tbsp, ground - 5.8g
Vitamin C
Vit. C
Vitamin D
Vit. D
Vitamin A
Vit. A
Vitamin E
Vit. E
Vitamin B1
Vit. B1
Vitamin B2
Vit. B2
Vitamin B3
Vit. B3
Vitamin B5
Vit. B5
Vitamin B6
Vit. B6
Vitamin B12
Vit. B12
Vitamin K
Vit. K
Folate
Folate
70%
0%
0%
0%
50%
42%
21%
0%
53%
0%
0%
0%
8
100 g
300 g
0.25 tsp, whole - 0.5g 1 tbsp, whole - 6g
Vitamin C
Vit. C
Vitamin D
Vit. D
Vitamin A
Vit. A
Vitamin E
Vit. E
Vitamin B1
Vit. B1
Vitamin B2
Vit. B2
Vitamin B3
Vit. B3
Vitamin B5
Vit. B5
Vitamin B6
Vit. B6
Vitamin B12
Vit. B12
Vitamin K
Vit. K
Folate
Folate
26%
0%
21%
67%
157%
75%
86%
0%
100%
0%
14%
7.5%
All nutrients comparison - raw data values
Nutrient
DV% diff.
Manganese
28mg
3.333mg
1072%
Iron
13.97mg
66.36mg
655%
Fiber
28g
10.5g
70%
Calcium
383mg
931mg
55%
Copper
0.383mg
0.867mg
54%
Phosphorus
178mg
499mg
46%
Vitamin B1
0.198mg
0.628mg
36%
Magnesium
229mg
366mg
33%
Monounsaturated fat
0.87g
14.04g
33%
Fats
6.7g
22.27g
24%
Zinc
7.47mg
4.8mg
24%
Vitamin E
3.33mg
22%
Vitamin B3
1.102mg
4.579mg
22%
Potassium
1119mg
1788mg
20%
Polyunsaturated fat
0.43g
3.279g
19%
Vitamin B6
0.23mg
0.435mg
16%
Vitamin C
21mg
7.7mg
15%
Protein
10.76g
17.81g
14%
Vitamin B2
0.182mg
0.327mg
11%
Selenium
5.2µg
9%
Carbs
68.47g
44.24g
8%
Sodium
18mg
168mg
7%
Vitamin A
0µg
64µg
7%
Vitamin K
5.4µg
5%
Choline
24.7mg
4%
Saturated fat
0.68g
1.535g
4%
Calories
311kcal
375kcal
3%
Folate
10µg
3%
Protein per 100 calories
3.5g
4.7g
N/A
Calories per 10 g protein
289kcal
211kcal
N/A
Weight per 100 calories
32g
27g
N/A
Unsaturated / Saturated Fat ratio
1.9
11
N/A
Net carbs
40.47g
33.74g
N/A
Sugar
2.25g
N/A
Macronutrient Comparison
Macronutrient breakdown side-by-side comparison
2
11%
7%
68%
8%
6%
Protein:
10.76 g
Fats:
6.7 g
Carbs:
68.47 g
Water:
8.28 g
Other:
5.79 g
3
18%
22%
44%
8%
8%
Protein:
17.81 g
Fats:
22.27 g
Carbs:
44.24 g
Water:
8.06 g
Other:
7.62 g
Contains
more
Carbs Carbs
+54.8%
Contains
more
Protein Protein
+65.5%
Contains
more
Fats Fats
+232.4%
Contains
more
Other Other
+31.6%
Fat Type Comparison
Fat type breakdown side-by-side comparison
1
34%
44%
22%
Saturated fat:
Sat. Fat
0.68 g
Monounsaturated fat:
Mono. Fat
0.87 g
Polyunsaturated fat:
Poly. Fat
0.43 g
2
8%
74%
17%
Saturated fat:
Sat. Fat
1.535 g
Monounsaturated fat:
Mono. Fat
14.04 g
Polyunsaturated fat:
Poly. Fat
3.279 g
Contains
less
Sat. Fat Saturated fat
-55.7%
Contains
more
Mono. Fat Monounsaturated fat
+1513.8%
Contains
more
Poly. Fat Polyunsaturated fat
+662.6%