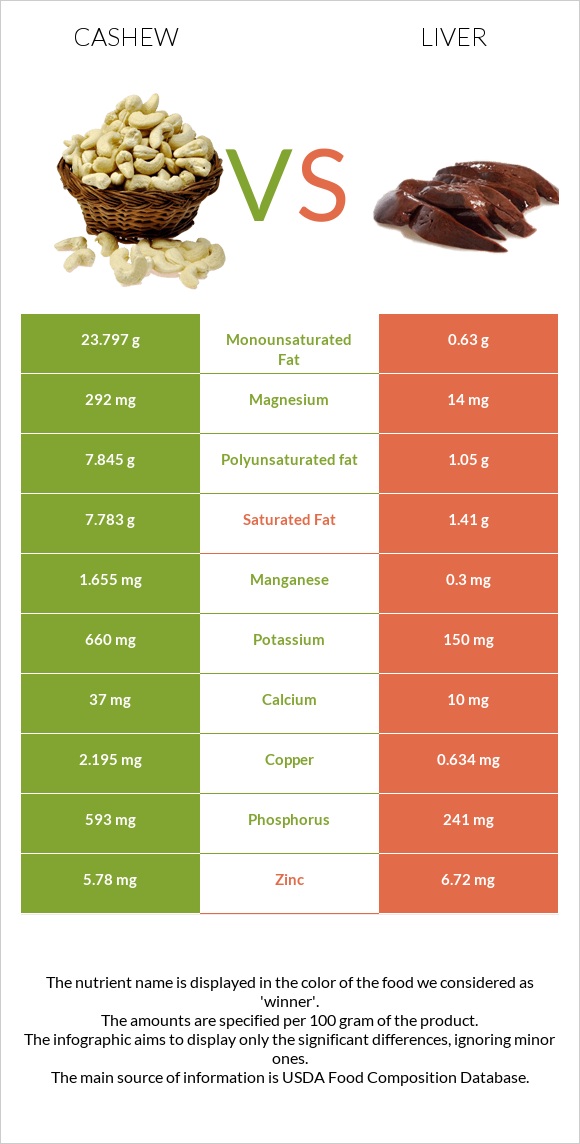
How are cashew and liver different? Cashew is richer in copper, magnesium, and manganese, while liver is higher in vitamin B12, vitamin A, vitamin B2, iron, selenium, and vitamin B5. Liver covers your daily need for vitamin B12, 778% more than cashew. Cashew contains 21 times more magnesium than liver. Cashew contains 292mg of magnesium, while liver contains 14mg. Cashew has a higher glycemic index (25) than liver (0). Nuts, cashew nuts, raw and Pork, fresh, variety meats, and by-products, liver, cooked, braised types were used in this article.
Infographic
Mineral Comparison
Mineral comparison score is based on the number of minerals by which one or the other food is richer. The "coverage" charts below show how much of the daily needs can be covered by 300 grams of the food.
7
100 g
300 g
1 oz - 28.35g
Magnesium
Magnesium
Calcium
Calcium
Potassium
Potassium
Iron
Iron
Copper
Copper
Zinc
Zinc
Phosphorus
Phosphorus
Sodium
Sodium
Manganese
Manganese
Selenium
Selenium
209%
11%
58%
251%
732%
158%
254%
1.6%
216%
109%
3
100 g
300 g
3 oz - 85g
Magnesium
Magnesium
Calcium
Calcium
Potassium
Potassium
Iron
Iron
Copper
Copper
Zinc
Zinc
Phosphorus
Phosphorus
Sodium
Sodium
Manganese
Manganese
Selenium
Selenium
10%
3%
13%
672%
211%
183%
103%
6.4%
39%
368%
Vitamin Comparison
Vitamin comparison score is based on the number of vitamins by which one or the other food is richer. The "coverage" charts below show how much of the daily needs can be covered by 300 grams of the food.
3
100 g
300 g
1 oz - 28.35g
Vitamin C
Vit. C
Vitamin D
Vit. D
Vitamin A
Vit. A
Vitamin E
Vit. E
Vitamin B1
Vit. B1
Vitamin B2
Vit. B2
Vitamin B3
Vit. B3
Vitamin B5
Vit. B5
Vitamin B6
Vit. B6
Vitamin B12
Vit. B12
Vitamin K
Vit. K
Folate
Folate
1.7%
0%
0%
18%
106%
13%
20%
52%
96%
0%
85%
19%
8
100 g
300 g
3 oz - 85g
Vitamin C
Vit. C
Vitamin D
Vit. D
Vitamin A
Vit. A
Vitamin E
Vit. E
Vitamin B1
Vit. B1
Vitamin B2
Vit. B2
Vitamin B3
Vit. B3
Vitamin B5
Vit. B5
Vitamin B6
Vit. B6
Vitamin B12
Vit. B12
Vitamin K
Vit. K
Folate
Folate
79%
0%
1802%
0%
65%
507%
158%
286%
132%
2334%
0%
122%
All nutrients comparison - raw data values
Nutrient
DV% diff.
Vitamin B12
0µg
18.67µg
778%
Vitamin A
0µg
5405µg
601%
Copper
2.195mg
0.634mg
173%
Vitamin B2
0.058mg
2.196mg
164%
Iron
6.68mg
17.92mg
141%
Cholesterol
0mg
355mg
118%
Selenium
19.9µg
67.5µg
87%
Vitamin B5
0.864mg
4.774mg
78%
Magnesium
292mg
14mg
66%
Fats
43.85g
4.4g
61%
Manganese
1.655mg
0.3mg
59%
Monounsaturated fat
23.797g
0.63g
58%
Phosphorus
593mg
241mg
50%
Vitamin B3
1.062mg
8.435mg
46%
Polyunsaturated fat
7.845g
1.05g
45%
Folate
25µg
163µg
35%
Saturated fat
7.783g
1.41g
29%
Vitamin K
34.1µg
28%
Vitamin C
0.5mg
23.6mg
26%
Calories
553kcal
165kcal
19%
Protein
18.22g
26.02g
16%
Potassium
660mg
150mg
15%
Vitamin B1
0.423mg
0.258mg
14%
Fiber
3.3g
0g
13%
Vitamin B6
0.417mg
0.57mg
12%
Starch
23.49g
10%
Carbs
30.19g
3.76g
9%
Zinc
5.78mg
6.72mg
9%
Vitamin E
0.9mg
6%
Calcium
37mg
10mg
3%
Sodium
12mg
49mg
2%
Protein per 100 calories
3.3g
16g
N/A
Calories per 10 g protein
304kcal
63kcal
N/A
Weight per 100 calories
18g
61g
N/A
Unsaturated / Saturated Fat ratio
4.1
1.2
N/A
Net carbs
26.89g
3.76g
N/A
Sugar
5.91g
N/A
Tryptophan
0.287mg
0.366mg
0%
Threonine
0.688mg
1.107mg
0%
Isoleucine
0.789mg
1.32mg
0%
Leucine
1.472mg
2.319mg
0%
Lysine
0.928mg
2.007mg
0%
Methionine
0.362mg
0.645mg
0%
Phenylalanine
0.951mg
1.274mg
0%
Valine
1.094mg
1.607mg
0%
Histidine
0.456mg
0.708mg
0%
Fructose
0.05g
0%
Omega-3 - DHA
0g
0.03g
N/A
Omega-3 - DPA
0g
0.04g
N/A
Macronutrient Comparison
Macronutrient breakdown side-by-side comparison
3
18%
44%
30%
5%
3%
Protein:
18.22 g
Fats:
43.85 g
Carbs:
30.19 g
Water:
5.2 g
Other:
2.54 g
2
26%
4%
4%
64%
Protein:
26.02 g
Fats:
4.4 g
Carbs:
3.76 g
Water:
64.32 g
Other:
1.5 g
Contains
more
Fats Fats
+896.6%
Contains
more
Carbs Carbs
+702.9%
Contains
more
Other Other
+69.3%
Contains
more
Protein Protein
+42.8%
Contains
more
Water Water
+1136.9%
Fat Type Comparison
Fat type breakdown side-by-side comparison
2
20%
60%
20%
Saturated fat:
Sat. Fat
7.783 g
Monounsaturated fat:
Mono. Fat
23.797 g
Polyunsaturated fat:
Poly. Fat
7.845 g
1
46%
20%
34%
Saturated fat:
Sat. Fat
1.41 g
Monounsaturated fat:
Mono. Fat
0.63 g
Polyunsaturated fat:
Poly. Fat
1.05 g
Contains
more
Mono. Fat Monounsaturated fat
+3677.3%
Contains
more
Poly. Fat Polyunsaturated fat
+647.1%
Contains
less
Sat. Fat Saturated fat
-81.9%