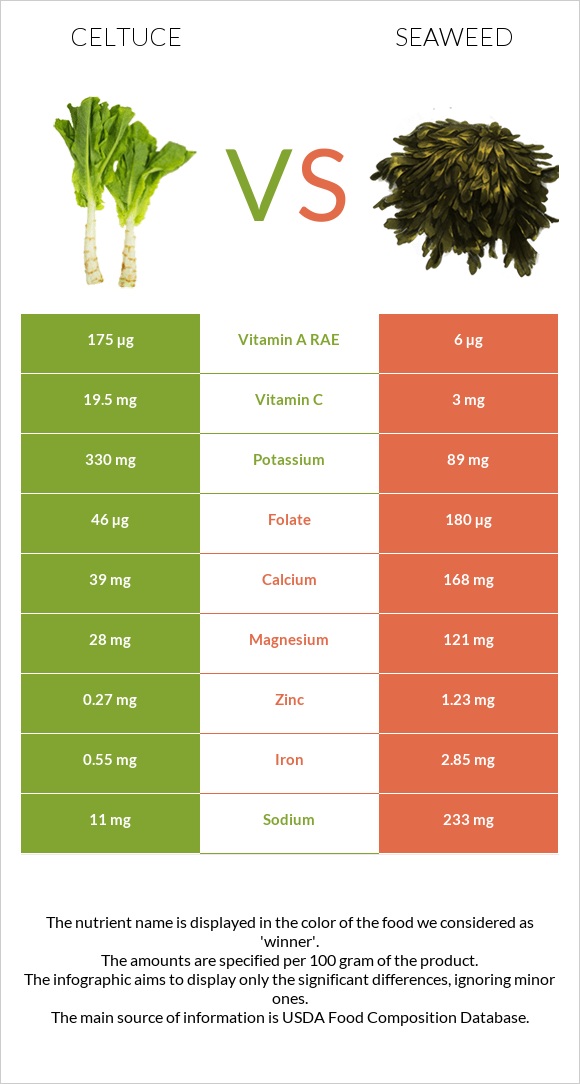
Significant differences between celtuce and seaweed Celtuce has more vitamin A, manganese, and vitamin C; however, seaweed is richer in folate, iron, magnesium, calcium, copper, and vitamin B5. Celtuce covers your daily vitamin A needs 68% more than seaweed. Seaweed has 7 times less vitamin C than celtuce. Celtuce has 19.5mg of vitamin C, while seaweed has 3mg. Celtuce contains less sodium. Specific food types used in this comparison are Celtuce, raw and Seaweed, kelp, raw .
Infographic
Mineral Comparison
Mineral comparison score is based on the number of minerals by which one or the other food is richer. The "coverage" charts below show how much of the daily needs can be covered by 300 grams of the food.
4
100 g
300 g
1 leaf - 8g
Magnesium
Magnesium
Calcium
Calcium
Potassium
Potassium
Iron
Iron
Copper
Copper
Zinc
Zinc
Phosphorus
Phosphorus
Sodium
Sodium
Manganese
Manganese
Selenium
Selenium
20%
12%
29%
21%
13%
7.4%
17%
1.4%
90%
4.9%
5
100 g
300 g
2 tbsp (1/8 cup) - 10g
Magnesium
Magnesium
Calcium
Calcium
Potassium
Potassium
Iron
Iron
Copper
Copper
Zinc
Zinc
Phosphorus
Phosphorus
Sodium
Sodium
Manganese
Manganese
Selenium
Selenium
86%
50%
7.9%
107%
43%
34%
18%
30%
26%
3.8%
Vitamin Comparison
Vitamin comparison score is based on the number of vitamins by which one or the other food is richer. The "coverage" charts below show how much of the daily needs can be covered by 300 grams of the food.
4
100 g
300 g
1 leaf - 8g
Vitamin C
Vit. C
Vitamin D
Vit. D
Vitamin A
Vit. A
Vitamin E
Vit. E
Vitamin B1
Vit. B1
Vitamin B2
Vit. B2
Vitamin B3
Vit. B3
Vitamin B5
Vit. B5
Vitamin B6
Vit. B6
Vitamin B12
Vit. B12
Vitamin K
Vit. K
Folate
Folate
65%
0%
58%
0%
14%
16%
10%
11%
12%
0%
0%
35%
5
100 g
300 g
2 tbsp (1/8 cup) - 10g
Vitamin C
Vit. C
Vitamin D
Vit. D
Vitamin A
Vit. A
Vitamin E
Vit. E
Vitamin B1
Vit. B1
Vitamin B2
Vit. B2
Vitamin B3
Vit. B3
Vitamin B5
Vit. B5
Vitamin B6
Vit. B6
Vitamin B12
Vit. B12
Vitamin K
Vit. K
Folate
Folate
10%
0%
2%
17%
13%
35%
8.8%
39%
0.46%
0%
165%
135%
All nutrients comparison - raw data values
Nutrient
DV% diff.
Vitamin K
66µg
55%
Folate
46µg
180µg
34%
Iron
0.55mg
2.85mg
29%
Magnesium
28mg
121mg
22%
Manganese
0.688mg
0.2mg
21%
Vitamin A
175µg
6µg
19%
Vitamin C
19.5mg
3mg
18%
Calcium
39mg
168mg
13%
Copper
0.04mg
0.13mg
10%
Sodium
11mg
233mg
10%
Zinc
0.27mg
1.23mg
9%
Vitamin B5
0.183mg
0.642mg
9%
Potassium
330mg
89mg
7%
Vitamin E
0.87mg
6%
Vitamin B2
0.07mg
0.15mg
6%
Vitamin B6
0.05mg
0.002mg
4%
Protein
0.85g
1.68g
2%
Carbs
3.65g
9.57g
2%
Fiber
1.7g
1.3g
2%
Choline
12.8mg
2%
Calories
18kcal
43kcal
1%
Vitamin B3
0.55mg
0.47mg
1%
Saturated fat
0.247g
1%
Protein per 100 calories
4.7g
3.9g
N/A
Calories per 10 g protein
212kcal
256kcal
N/A
Weight per 100 calories
556g
233g
N/A
Fats
0.3g
0.56g
0%
Net carbs
1.95g
8.27g
N/A
Sugar
0.6g
N/A
Phosphorus
39mg
42mg
0%
Selenium
0.9µg
0.7µg
0%
Vitamin B1
0.055mg
0.05mg
0%
Monounsaturated fat
0.098g
0%
Polyunsaturated fat
0.047g
0%
Tryptophan
0.006mg
0.048mg
0%
Threonine
0.039mg
0.055mg
0%
Isoleucine
0.055mg
0.076mg
0%
Leucine
0.052mg
0.083mg
0%
Lysine
0.055mg
0.082mg
0%
Methionine
0.01mg
0.025mg
0%
Phenylalanine
0.036mg
0.043mg
0%
Valine
0.046mg
0.072mg
0%
Histidine
0.015mg
0.024mg
0%
Omega-3 - EPA
0.004g
N/A
Macronutrient Comparison
Macronutrient breakdown side-by-side comparison
1
4%
95%
Protein:
0.85 g
Fats:
0.3 g
Carbs:
3.65 g
Water:
94.5 g
Other:
0.7 g
4
2%
10%
82%
7%
Protein:
1.68 g
Fats:
0.56 g
Carbs:
9.57 g
Water:
81.58 g
Other:
6.61 g
Contains
more
Water Water
+15.8%
Contains
more
Protein Protein
+97.6%
Contains
more
Fats Fats
+86.7%
Contains
more
Carbs Carbs
+162.2%
Contains
more
Other Other
+844.3%