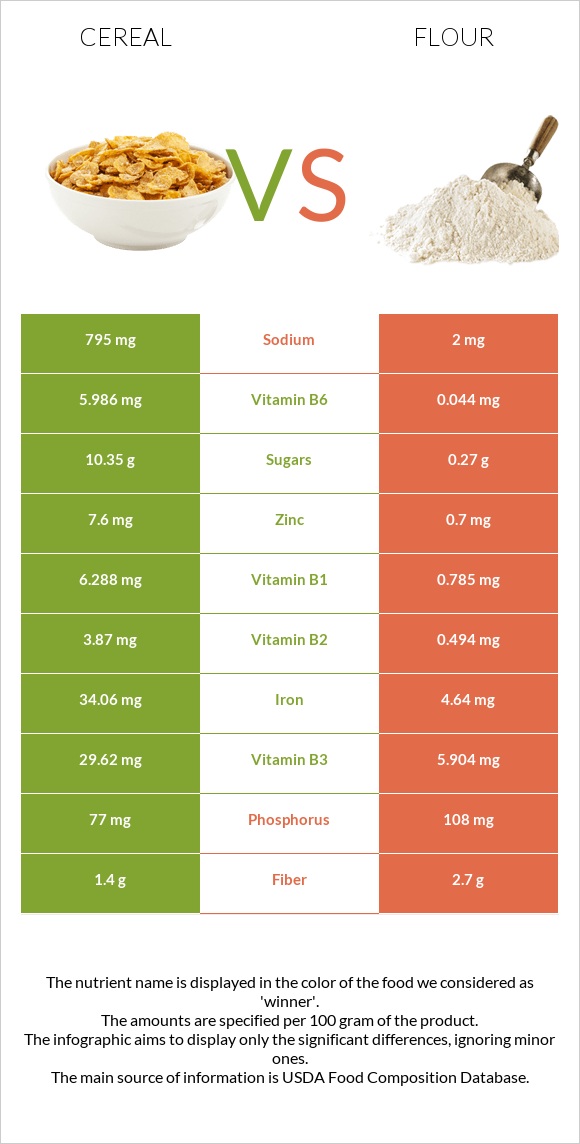
How are cereal and flour different? Cereal is higher in vitamin B1, vitamin B6, iron, vitamin B2, vitamin B3, zinc, vitamin A, and vitamin C; however, flour is richer in selenium. Daily need coverage for vitamin B1 for cereal is 459% higher. Flour has less sodium. Cereals ready-to-eat, USDA Commodity Corn and Rice (includes all commodity brands) and Wheat flour, white, all-purpose, enriched, bleached are the varieties used in this article.
Infographic
Mineral Comparison
Mineral comparison score is based on the number of minerals by which one or the other food is richer. The "coverage" charts below show how much of the daily needs can be covered by 300 grams of the food.
3
100 g
300 g
1 cup - 29g 1 serving (NLEA serving = 1 cup) - 29g
Magnesium
Magnesium
Calcium
Calcium
Potassium
Potassium
Iron
Iron
Copper
Copper
Zinc
Zinc
Phosphorus
Phosphorus
Sodium
Sodium
Manganese
Manganese
Selenium
Selenium
14%
3%
9.3%
1277%
46%
207%
33%
104%
103%
34%
5
100 g
300 g
1 cup - 125g
Magnesium
Magnesium
Calcium
Calcium
Potassium
Potassium
Iron
Iron
Copper
Copper
Zinc
Zinc
Phosphorus
Phosphorus
Sodium
Sodium
Manganese
Manganese
Selenium
Selenium
16%
4.5%
9.4%
174%
48%
19%
46%
0.26%
89%
185%
Vitamin Comparison
Vitamin comparison score is based on the number of vitamins by which one or the other food is richer. The "coverage" charts below show how much of the daily needs can be covered by 300 grams of the food.
7
100 g
300 g
1 cup - 29g 1 serving (NLEA serving = 1 cup) - 29g
Vitamin C
Vit. C
Vitamin D
Vit. D
Vitamin A
Vit. A
Vitamin E
Vit. E
Vitamin B1
Vit. B1
Vitamin B2
Vit. B2
Vitamin B3
Vit. B3
Vitamin B5
Vit. B5
Vitamin B6
Vit. B6
Vitamin B12
Vit. B12
Vitamin K
Vit. K
Folate
Folate
128%
0%
271%
1.6%
1572%
893%
555%
14%
1381%
0%
0%
0%
3
100 g
300 g
1 cup - 125g
Vitamin C
Vit. C
Vitamin D
Vit. D
Vitamin A
Vit. A
Vitamin E
Vit. E
Vitamin B1
Vit. B1
Vitamin B2
Vit. B2
Vitamin B3
Vit. B3
Vitamin B5
Vit. B5
Vitamin B6
Vit. B6
Vitamin B12
Vit. B12
Vitamin K
Vit. K
Folate
Folate
0%
0%
0%
1.2%
196%
114%
111%
26%
10%
0%
0.75%
137%
All nutrients comparison - raw data values
Nutrient
DV% diff.
Vitamin B1
6.288mg
0.785mg
459%
Vitamin B6
5.986mg
0.044mg
457%
Iron
34.06mg
4.64mg
368%
Vitamin B2
3.87mg
0.494mg
260%
Vitamin B3
29.62mg
5.904mg
148%
Vitamin A
814µg
0µg
90%
Zinc
7.6mg
0.7mg
63%
Selenium
6.3µg
33.9µg
50%
Folate
183µg
46%
Vitamin C
38.5mg
0mg
43%
Sodium
795mg
2mg
34%
Protein
6.06g
10.33g
9%
Fiber
1.4g
2.7g
5%
Manganese
0.79mg
0.682mg
5%
Carbs
86.85g
76.31g
4%
Phosphorus
77mg
108mg
4%
Vitamin B5
0.226mg
0.438mg
4%
Choline
10.4mg
2%
Calories
378kcal
364kcal
1%
Magnesium
19mg
22mg
1%
Calcium
10mg
15mg
1%
Copper
0.137mg
0.144mg
1%
Protein per 100 calories
1.6g
2.8g
N/A
Calories per 10 g protein
624kcal
352kcal
N/A
Weight per 100 calories
26g
27g
N/A
Fats
1.08g
0.98g
0%
Net carbs
85.45g
73.61g
N/A
Potassium
105mg
107mg
0%
Sugar
10.35g
0.27g
N/A
Vitamin E
0.08mg
0.06mg
0%
Vitamin K
0µg
0.3µg
0%
Saturated fat
0.26g
0.155g
0%
Monounsaturated fat
0.204g
0.087g
0%
Polyunsaturated fat
0.354g
0.413g
0%
Tryptophan
0.066mg
0.127mg
0%
Threonine
0.241mg
0.281mg
0%
Isoleucine
0.26mg
0.357mg
0%
Leucine
0.767mg
0.71mg
0%
Lysine
0.113mg
0.228mg
0%
Methionine
0.13mg
0.183mg
0%
Phenylalanine
0.365mg
0.52mg
0%
Valine
0.344mg
0.415mg
0%
Histidine
0.162mg
0.23mg
0%
Fructose
0.26g
0%
Macronutrient Comparison
Macronutrient breakdown side-by-side comparison
3
6%
87%
4%
2%
Protein:
6.06 g
Fats:
1.08 g
Carbs:
86.85 g
Water:
3.78 g
Other:
2.23 g
2
10%
76%
12%
Protein:
10.33 g
Fats:
0.98 g
Carbs:
76.31 g
Water:
11.92 g
Other:
0.46 g
Contains
more
Carbs Carbs
+13.8%
Contains
more
Other Other
+384.8%
Contains
more
Protein Protein
+70.5%
Contains
more
Water Water
+215.3%
Fat Type Comparison
Fat type breakdown side-by-side comparison
1
32%
25%
43%
Saturated fat:
Sat. Fat
0.26 g
Monounsaturated fat:
Mono. Fat
0.204 g
Polyunsaturated fat:
Poly. Fat
0.354 g
2
24%
13%
63%
Saturated fat:
Sat. Fat
0.155 g
Monounsaturated fat:
Mono. Fat
0.087 g
Polyunsaturated fat:
Poly. Fat
0.413 g
Contains
more
Mono. Fat Monounsaturated fat
+134.5%
Contains
less
Sat. Fat Saturated fat
-40.4%
Contains
more
Poly. Fat Polyunsaturated fat
+16.7%