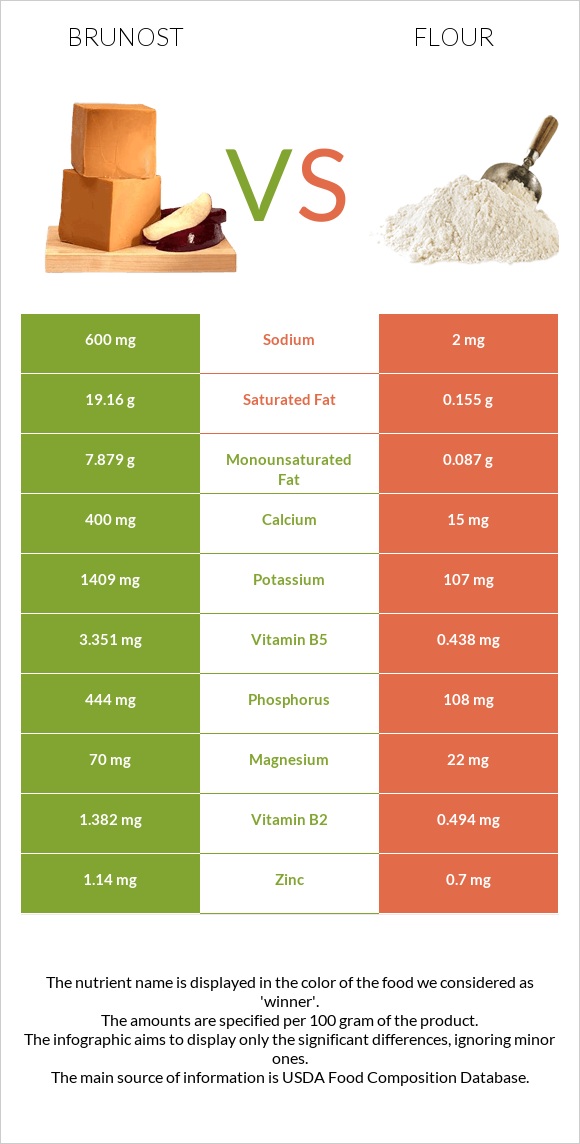
Important differences between brunost and flour Brunost has more vitamin B12, vitamin B2, vitamin B5, phosphorus, calcium, and potassium; however, flour is richer in iron, folate, and vitamin B1. Brunost's daily need coverage for vitamin B12 is 101% more. Brunost contains 124 times more saturated fat than flour. Brunost contains 19.16g of saturated fat, while flour contains 0.155g. Flour has a higher glycemic index. The glycemic index of flour is 72, while the glycemic index of brunost is 27. The food varieties used in the comparison are Cheese, gjetost and Wheat flour, white, all-purpose, enriched, bleached .
Infographic
Mineral Comparison
Mineral comparison score is based on the number of minerals by which one or the other food is richer. The "coverage" charts below show how much of the daily needs can be covered by 300 grams of the food.
5
100 g
300 g
1 oz - 28.35g 1 package (8 oz) - 227g
Magnesium
Magnesium
Calcium
Calcium
Potassium
Potassium
Iron
Iron
Copper
Copper
Zinc
Zinc
Phosphorus
Phosphorus
Sodium
Sodium
Manganese
Manganese
Selenium
Selenium
50%
120%
124%
20%
27%
31%
190%
78%
5.2%
79%
5
100 g
300 g
1 cup - 125g
Magnesium
Magnesium
Calcium
Calcium
Potassium
Potassium
Iron
Iron
Copper
Copper
Zinc
Zinc
Phosphorus
Phosphorus
Sodium
Sodium
Manganese
Manganese
Selenium
Selenium
16%
4.5%
9.4%
174%
48%
19%
46%
0.26%
89%
185%
Vitamin Comparison
Vitamin comparison score is based on the number of vitamins by which one or the other food is richer. The "coverage" charts below show how much of the daily needs can be covered by 300 grams of the food.
5
100 g
300 g
1 oz - 28.35g 1 package (8 oz) - 227g
Vitamin C
Vit. C
Vitamin D
Vit. D
Vitamin A
Vit. A
Vitamin E
Vit. E
Vitamin B1
Vit. B1
Vitamin B2
Vit. B2
Vitamin B3
Vit. B3
Vitamin B5
Vit. B5
Vitamin B6
Vit. B6
Vitamin B12
Vit. B12
Vitamin K
Vit. K
Folate
Folate
0%
0%
111%
0%
79%
319%
15%
201%
63%
303%
0%
3.8%
5
100 g
300 g
1 cup - 125g
Vitamin C
Vit. C
Vitamin D
Vit. D
Vitamin A
Vit. A
Vitamin E
Vit. E
Vitamin B1
Vit. B1
Vitamin B2
Vit. B2
Vitamin B3
Vit. B3
Vitamin B5
Vit. B5
Vitamin B6
Vit. B6
Vitamin B12
Vit. B12
Vitamin K
Vit. K
Folate
Folate
0%
0%
0%
1.2%
196%
114%
111%
26%
10%
0%
0.75%
137%
All nutrients comparison - raw data values
Nutrient
DV% diff.
Vitamin B12
2.42µg
0µg
101%
Saturated fat
19.16g
0.155g
86%
Vitamin B2
1.382mg
0.494mg
68%
Vitamin B5
3.351mg
0.438mg
58%
Iron
0.52mg
4.64mg
52%
Phosphorus
444mg
108mg
48%
Folate
5µg
183µg
45%
Fats
29.51g
0.98g
44%
Calcium
400mg
15mg
39%
Vitamin B1
0.315mg
0.785mg
39%
Potassium
1409mg
107mg
38%
Vitamin A
334µg
0µg
37%
Selenium
14.5µg
33.9µg
35%
Vitamin B3
0.813mg
5.904mg
32%
Cholesterol
94mg
0mg
31%
Manganese
0.04mg
0.682mg
28%
Sodium
600mg
2mg
26%
Monounsaturated fat
7.879g
0.087g
19%
Vitamin B6
0.271mg
0.044mg
17%
Carbs
42.65g
76.31g
11%
Magnesium
70mg
22mg
11%
Fiber
0g
2.7g
11%
Copper
0.08mg
0.144mg
7%
Calories
466kcal
364kcal
5%
Zinc
1.14mg
0.7mg
4%
Polyunsaturated fat
0.938g
0.413g
4%
Choline
10.4mg
2%
Protein
9.65g
10.33g
1%
Protein per 100 calories
2.1g
2.8g
N/A
Calories per 10 g protein
483kcal
352kcal
N/A
Weight per 100 calories
21g
27g
N/A
Unsaturated / Saturated Fat ratio
0.46
3.2
N/A
Net carbs
42.65g
73.61g
N/A
Sugar
0.27g
N/A
Vitamin E
0.06mg
0%
Vitamin K
0.3µg
0%
Tryptophan
0.135mg
0.127mg
0%
Threonine
0.393mg
0.281mg
0%
Isoleucine
0.519mg
0.357mg
0%
Leucine
0.992mg
0.71mg
0%
Lysine
0.814mg
0.228mg
0%
Methionine
0.318mg
0.183mg
0%
Phenylalanine
0.54mg
0.52mg
0%
Valine
0.765mg
0.415mg
0%
Histidine
0.293mg
0.23mg
0%
Macronutrient Comparison
Macronutrient breakdown side-by-side comparison
3
10%
30%
43%
13%
5%
Protein:
9.65 g
Fats:
29.51 g
Carbs:
42.65 g
Water:
13.44 g
Other:
4.75 g
2
10%
76%
12%
Protein:
10.33 g
Fats:
0.98 g
Carbs:
76.31 g
Water:
11.92 g
Other:
0.46 g
Contains
more
Fats Fats
+2911.2%
Contains
more
Water Water
+12.8%
Contains
more
Other Other
+932.6%
Contains
more
Carbs Carbs
+78.9%
~equal in
Protein
~10.33g
Fat Type Comparison
Fat type breakdown side-by-side comparison
2
68%
28%
3%
Saturated fat:
Sat. Fat
19.16 g
Monounsaturated fat:
Mono. Fat
7.879 g
Polyunsaturated fat:
Poly. Fat
0.938 g
1
24%
13%
63%
Saturated fat:
Sat. Fat
0.155 g
Monounsaturated fat:
Mono. Fat
0.087 g
Polyunsaturated fat:
Poly. Fat
0.413 g
Contains
more
Mono. Fat Monounsaturated fat
+8956.3%
Contains
more
Poly. Fat Polyunsaturated fat
+127.1%
Contains
less
Sat. Fat Saturated fat
-99.2%