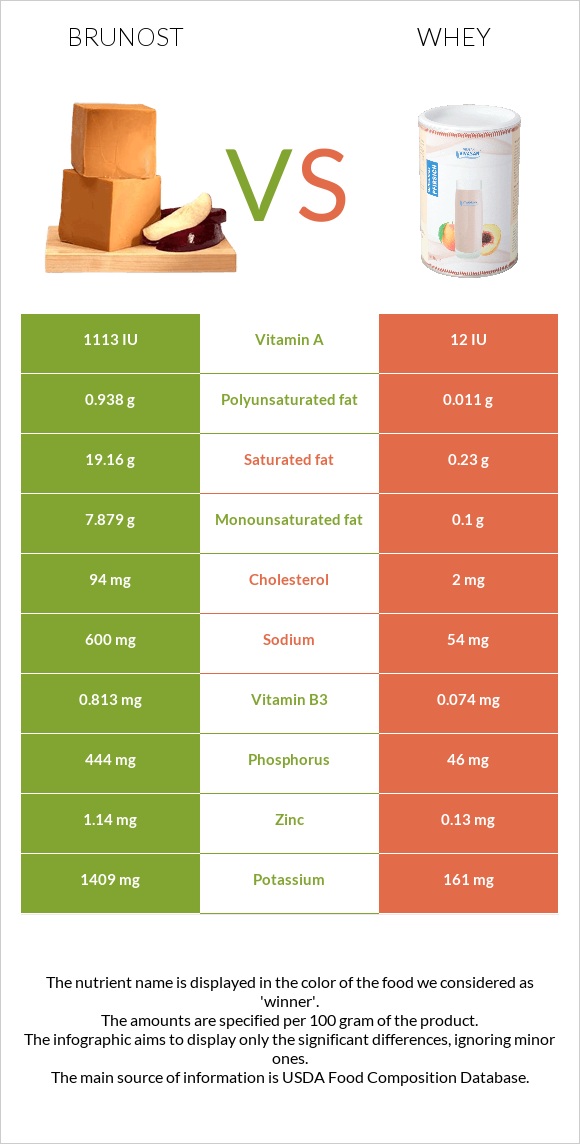
A recap on the differences between brunost and whey Whey has less vitamin B2, vitamin B12, vitamin B5, phosphorus, potassium, calcium, and vitamin B1. Brunost covers your daily saturated fat needs 95% more than whey. Whey contains 47 times less cholesterol than brunost. Brunost contains 94mg of cholesterol, while whey contains 2mg. Whey has less saturated fat. The glycemic index of whey is higher. Food varieties used in this article are Cheese, gjetost and Whey, sweet, fluid .
Infographic
Mineral Comparison
Mineral comparison score is based on the number of minerals by which one or the other food is richer. The "coverage" charts below show how much of the daily needs can be covered by 300 grams of the food.
9
100 g
300 g
1 oz - 28.35g 1 package (8 oz) - 227g
Magnesium
Magnesium
Calcium
Calcium
Potassium
Potassium
Iron
Iron
Copper
Copper
Zinc
Zinc
Phosphorus
Phosphorus
Sodium
Sodium
Manganese
Manganese
Selenium
Selenium
50%
120%
124%
20%
27%
31%
190%
78%
5.2%
79%
1
100 g
300 g
1 cup - 246g 1 quart - 984g
Magnesium
Magnesium
Calcium
Calcium
Potassium
Potassium
Iron
Iron
Copper
Copper
Zinc
Zinc
Phosphorus
Phosphorus
Sodium
Sodium
Manganese
Manganese
Selenium
Selenium
5.7%
14%
14%
2.3%
1.3%
3.5%
20%
7%
0.13%
10%
Vitamin Comparison
Vitamin comparison score is based on the number of vitamins by which one or the other food is richer. The "coverage" charts below show how much of the daily needs can be covered by 300 grams of the food.
8
100 g
300 g
1 oz - 28.35g 1 package (8 oz) - 227g
Vitamin C
Vit. C
Vitamin D
Vit. D
Vitamin A
Vit. A
Vitamin E
Vit. E
Vitamin B1
Vit. B1
Vitamin B2
Vit. B2
Vitamin B3
Vit. B3
Vitamin B5
Vit. B5
Vitamin B6
Vit. B6
Vitamin B12
Vit. B12
Vitamin K
Vit. K
Folate
Folate
0%
0%
111%
0%
79%
319%
15%
201%
63%
303%
0%
3.8%
1
100 g
300 g
1 cup - 246g 1 quart - 984g
Vitamin C
Vit. C
Vitamin D
Vit. D
Vitamin A
Vit. A
Vitamin E
Vit. E
Vitamin B1
Vit. B1
Vitamin B2
Vit. B2
Vitamin B3
Vit. B3
Vitamin B5
Vit. B5
Vitamin B6
Vit. B6
Vitamin B12
Vit. B12
Vitamin K
Vit. K
Folate
Folate
0.33%
0%
1%
0%
9%
36%
1.4%
23%
7.2%
35%
0%
0.75%
All nutrients comparison - raw data values
Nutrient
DV% diff.
Vitamin B2
1.382mg
0.158mg
94%
Vitamin B12
2.42µg
0.28µg
89%
Saturated fat
19.16g
0.23g
86%
Vitamin B5
3.351mg
0.383mg
59%
Phosphorus
444mg
46mg
57%
Fats
29.51g
0.36g
45%
Potassium
1409mg
161mg
37%
Vitamin A
334µg
3µg
37%
Calcium
400mg
47mg
35%
Cholesterol
94mg
2mg
31%
Sodium
600mg
54mg
24%
Selenium
14.5µg
1.9µg
23%
Vitamin B1
0.315mg
0.036mg
23%
Calories
466kcal
27kcal
22%
Monounsaturated fat
7.879g
0.1g
19%
Protein
9.65g
0.85g
18%
Vitamin B6
0.271mg
0.031mg
18%
Magnesium
70mg
8mg
15%
Carbs
42.65g
5.14g
13%
Zinc
1.14mg
0.13mg
9%
Copper
0.08mg
0.004mg
8%
Iron
0.52mg
0.06mg
6%
Polyunsaturated fat
0.938g
0.011g
6%
Vitamin B3
0.813mg
0.074mg
5%
Choline
16mg
3%
Manganese
0.04mg
0.001mg
2%
Folate
5µg
1µg
1%
Protein per 100 calories
2.1g
3.1g
N/A
Calories per 10 g protein
483kcal
318kcal
N/A
Weight per 100 calories
21g
370g
N/A
Unsaturated / Saturated Fat ratio
0.46
0.48
N/A
Vitamin C
0mg
0.1mg
0%
Net carbs
42.65g
5.14g
N/A
Sugar
5.14g
N/A
Tryptophan
0.135mg
0.013mg
0%
Threonine
0.393mg
0.054mg
0%
Isoleucine
0.519mg
0.047mg
0%
Leucine
0.992mg
0.078mg
0%
Lysine
0.814mg
0.068mg
0%
Methionine
0.318mg
0.016mg
0%
Phenylalanine
0.54mg
0.027mg
0%
Valine
0.765mg
0.046mg
0%
Histidine
0.293mg
0.016mg
0%
Macronutrient Comparison
Macronutrient breakdown side-by-side comparison
4
10%
30%
43%
13%
5%
Protein:
9.65 g
Fats:
29.51 g
Carbs:
42.65 g
Water:
13.44 g
Other:
4.75 g
1
5%
93%
Protein:
0.85 g
Fats:
0.36 g
Carbs:
5.14 g
Water:
93.12 g
Other:
0.53 g
Contains
more
Protein Protein
+1035.3%
Contains
more
Fats Fats
+8097.2%
Contains
more
Carbs Carbs
+729.8%
Contains
more
Other Other
+796.2%
Contains
more
Water Water
+592.9%
Fat Type Comparison
Fat type breakdown side-by-side comparison
2
68%
28%
3%
Saturated fat:
Sat. Fat
19.16 g
Monounsaturated fat:
Mono. Fat
7.879 g
Polyunsaturated fat:
Poly. Fat
0.938 g
1
67%
29%
3%
Saturated fat:
Sat. Fat
0.23 g
Monounsaturated fat:
Mono. Fat
0.1 g
Polyunsaturated fat:
Poly. Fat
0.011 g
Contains
more
Mono. Fat Monounsaturated fat
+7779%
Contains
more
Poly. Fat Polyunsaturated fat
+8427.3%
Contains
less
Sat. Fat Saturated fat
-98.8%