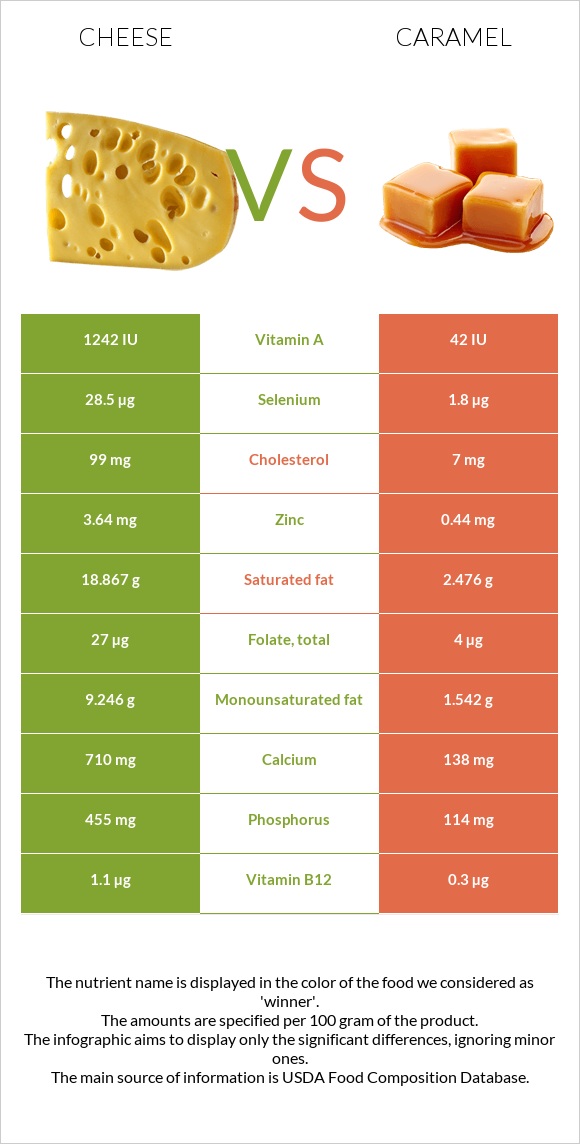
Summary of differences between cheese and caramel Caramel has less calcium, phosphorus, selenium, vitamin B12, zinc, vitamin A, and vitamin B2 than cheese. Cheese covers your daily need for saturated fat, 82% more than caramel. Cheese has 30 times more vitamin A than caramel. While cheese has 1242 IU of vitamin A, caramel has only 42 IU. Caramel has less cholesterol. The glycemic index of caramel is higher. These are the specific foods used in this comparison Cheese, cheddar and Candies, caramels .
Infographic
Mineral Comparison
Mineral comparison score is based on the number of minerals by which one or the other food is richer. The "coverage" charts below show how much of the daily needs can be covered by 300 grams of the food.
7
100 g
300 g
1 cubic inch - 17g 1 slice (1 oz) - 28g 1 oz - 28.35g 1 cup, shredded - 113g 1 cup, diced - 132g 1 cup, melted - 244g
Magnesium
Magnesium
Calcium
Calcium
Potassium
Potassium
Iron
Iron
Copper
Copper
Zinc
Zinc
Phosphorus
Phosphorus
Sodium
Sodium
Manganese
Manganese
Selenium
Selenium
19%
213%
6.7%
5.3%
10%
99%
195%
85%
3.5%
155%
2
100 g
300 g
1 piece - 10.1g 1 package (2.5 oz) - 71g
Magnesium
Magnesium
Calcium
Calcium
Potassium
Potassium
Iron
Iron
Copper
Copper
Zinc
Zinc
Phosphorus
Phosphorus
Sodium
Sodium
Manganese
Manganese
Selenium
Selenium
12%
41%
19%
5.3%
6%
12%
49%
32%
1.4%
9.8%
Vitamin Comparison
Vitamin comparison score is based on the number of vitamins by which one or the other food is richer. The "coverage" charts below show how much of the daily needs can be covered by 300 grams of the food.
8
100 g
300 g
1 cubic inch - 17g 1 slice (1 oz) - 28g 1 oz - 28.35g 1 cup, shredded - 113g 1 cup, diced - 132g 1 cup, melted - 244g
Vitamin C
Vit. C
Vitamin D
Vit. D
Vitamin A
Vit. A
Vitamin E
Vit. E
Vitamin B1
Vit. B1
Vitamin B2
Vit. B2
Vitamin B3
Vit. B3
Vitamin B5
Vit. B5
Vitamin B6
Vit. B6
Vitamin B12
Vit. B12
Vitamin K
Vit. K
Folate
Folate
0%
9%
110%
14%
7.3%
99%
1.1%
25%
15%
138%
6%
20%
4
100 g
300 g
1 piece - 10.1g 1 package (2.5 oz) - 71g
Vitamin C
Vit. C
Vitamin D
Vit. D
Vitamin A
Vit. A
Vitamin E
Vit. E
Vitamin B1
Vit. B1
Vitamin B2
Vit. B2
Vitamin B3
Vit. B3
Vitamin B5
Vit. B5
Vitamin B6
Vit. B6
Vitamin B12
Vit. B12
Vitamin K
Vit. K
Folate
Folate
1.3%
0%
4%
9.2%
26%
59%
2.8%
37%
13%
38%
4.5%
3%
All nutrients comparison - raw data values
Nutrient
DV% diff.
Saturated fat
18.867g
2.476g
75%
Calcium
710mg
138mg
57%
Phosphorus
455mg
114mg
49%
Selenium
28.5µg
1.8µg
49%
Fats
33.31g
8.1g
39%
Protein
22.87g
4.6g
37%
Vitamin A
330µg
12µg
35%
Vitamin B12
1.1µg
0.3µg
33%
Cholesterol
99mg
7mg
31%
Zinc
3.64mg
0.44mg
29%
Carbs
3.09g
77g
25%
Monounsaturated fat
9.246g
1.542g
19%
Sodium
653mg
245mg
18%
Polyunsaturated fat
1.421g
3.478g
14%
Vitamin B2
0.428mg
0.256mg
13%
Vitamin B1
0.029mg
0.103mg
6%
Folate
27µg
4µg
6%
Potassium
76mg
214mg
4%
Vitamin B5
0.41mg
0.62mg
4%
Vitamin D*
24 IU
0 IU
3%
Vitamin D
0.6µg
0µg
3%
Magnesium
27mg
17mg
2%
Vitamin E
0.71mg
0.46mg
2%
Choline
16.5mg
8mg
2%
Calories
404kcal
382kcal
1%
Copper
0.03mg
0.018mg
1%
Manganese
0.027mg
0.011mg
1%
Vitamin B3
0.059mg
0.148mg
1%
Vitamin B6
0.066mg
0.056mg
1%
Vitamin K
2.4µg
1.8µg
1%
Protein per 100 calories
5.7g
1.2g
N/A
Calories per 10 g protein
177kcal
830kcal
N/A
Weight per 100 calories
25g
26g
N/A
Unsaturated / Saturated Fat ratio
0.57
2
N/A
Vitamin C
0mg
0.4mg
0%
Net carbs
3.09g
77g
N/A
Iron
0.14mg
0.14mg
0%
Sugar
0.48g
65.5g
N/A
Trans fat
0.917g
N/A
Tryptophan
0.547mg
0.06mg
0%
Threonine
1.044mg
0.192mg
0%
Isoleucine
1.206mg
0.258mg
0%
Leucine
1.939mg
0.417mg
0%
Lysine
1.025mg
0.338mg
0%
Methionine
0.547mg
0.107mg
0%
Phenylalanine
1.074mg
0.205mg
0%
Valine
1.404mg
0.285mg
0%
Histidine
0.547mg
0.115mg
0%
Omega-3 - EPA
0.01g
0g
N/A
Omega-3 - DHA
0.001g
0g
N/A
Omega-3 - DPA
0.017g
0g
N/A
Omega-6 - Eicosadienoic acid
0.007g
N/A
Macronutrient Comparison
Macronutrient breakdown side-by-side comparison
4
23%
33%
3%
37%
4%
Protein:
22.87 g
Fats:
33.31 g
Carbs:
3.09 g
Water:
37.02 g
Other:
3.71 g
1
5%
8%
77%
9%
2%
Protein:
4.6 g
Fats:
8.1 g
Carbs:
77 g
Water:
8.5 g
Other:
1.8 g
Contains
more
Protein Protein
+397.2%
Contains
more
Fats Fats
+311.2%
Contains
more
Water Water
+335.5%
Contains
more
Other Other
+106.1%
Contains
more
Carbs Carbs
+2391.9%
Fat Type Comparison
Fat type breakdown side-by-side comparison
1
64%
31%
5%
Saturated fat:
Sat. Fat
18.867 g
Monounsaturated fat:
Mono. Fat
9.246 g
Polyunsaturated fat:
Poly. Fat
1.421 g
2
33%
21%
46%
Saturated fat:
Sat. Fat
2.476 g
Monounsaturated fat:
Mono. Fat
1.542 g
Polyunsaturated fat:
Poly. Fat
3.478 g
Contains
more
Mono. Fat Monounsaturated fat
+499.6%
Contains
less
Sat. Fat Saturated fat
-86.9%
Contains
more
Poly. Fat Polyunsaturated fat
+144.8%