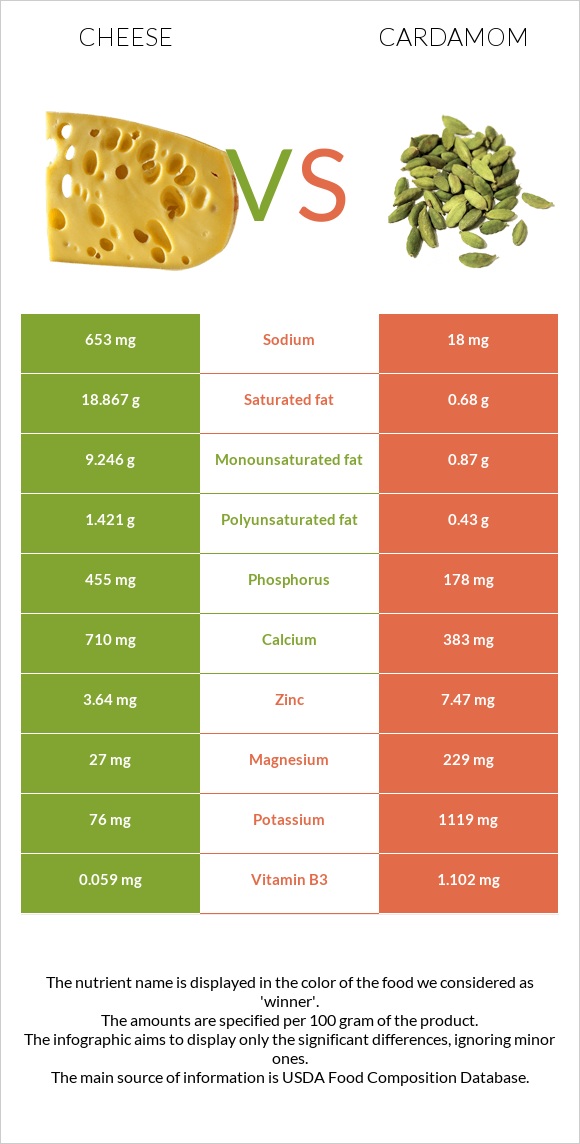
A recap on the differences between cheese and cardamom Cheese is higher in vitamin B12 and phosphorus, yet cardamom is higher in manganese, iron, fiber, magnesium, copper, and zinc. Cardamom covers your daily manganese needs 1216% more than cheese. The amount of cholesterol in cardamom is lower. Food varieties used in this article are Cheese, cheddar and Spices, cardamom .
Infographic
Mineral Comparison
Mineral comparison score is based on the number of minerals by which one or the other food is richer. The "coverage" charts below show how much of the daily needs can be covered by 300 grams of the food.
3
100 g
300 g
1 cubic inch - 17g 1 slice (1 oz) - 28g 1 oz - 28.35g 1 cup, shredded - 113g 1 cup, diced - 132g 1 cup, melted - 244g
Magnesium
Magnesium
Calcium
Calcium
Potassium
Potassium
Iron
Iron
Copper
Copper
Zinc
Zinc
Phosphorus
Phosphorus
Sodium
Sodium
Manganese
Manganese
Selenium
Selenium
19%
213%
6.7%
5.3%
10%
99%
195%
85%
3.5%
155%
7
100 g
300 g
1 tsp, ground - 2g 1 tbsp, ground - 5.8g
Magnesium
Magnesium
Calcium
Calcium
Potassium
Potassium
Iron
Iron
Copper
Copper
Zinc
Zinc
Phosphorus
Phosphorus
Sodium
Sodium
Manganese
Manganese
Selenium
Selenium
164%
115%
99%
524%
128%
204%
76%
2.3%
3652%
0%
Vitamin Comparison
Vitamin comparison score is based on the number of vitamins by which one or the other food is richer. The "coverage" charts below show how much of the daily needs can be covered by 300 grams of the food.
8
100 g
300 g
1 cubic inch - 17g 1 slice (1 oz) - 28g 1 oz - 28.35g 1 cup, shredded - 113g 1 cup, diced - 132g 1 cup, melted - 244g
Vitamin C
Vit. C
Vitamin D
Vit. D
Vitamin A
Vit. A
Vitamin E
Vit. E
Vitamin B1
Vit. B1
Vitamin B2
Vit. B2
Vitamin B3
Vit. B3
Vitamin B5
Vit. B5
Vitamin B6
Vit. B6
Vitamin B12
Vit. B12
Vitamin K
Vit. K
Folate
Folate
0%
9%
110%
14%
7.3%
99%
1.1%
25%
15%
138%
6%
20%
4
100 g
300 g
1 tsp, ground - 2g 1 tbsp, ground - 5.8g
Vitamin C
Vit. C
Vitamin D
Vit. D
Vitamin A
Vit. A
Vitamin E
Vit. E
Vitamin B1
Vit. B1
Vitamin B2
Vit. B2
Vitamin B3
Vit. B3
Vitamin B5
Vit. B5
Vitamin B6
Vit. B6
Vitamin B12
Vit. B12
Vitamin K
Vit. K
Folate
Folate
70%
0%
0%
0%
50%
42%
21%
0%
53%
0%
0%
0%
All nutrients comparison - raw data values
Nutrient
DV% diff.
Manganese
0.027mg
28mg
1216%
Iron
0.14mg
13.97mg
173%
Fiber
0g
28g
112%
Saturated fat
18.867g
0.68g
83%
Selenium
28.5µg
52%
Magnesium
27mg
229mg
48%
Vitamin B12
1.1µg
0µg
46%
Fats
33.31g
6.7g
41%
Phosphorus
455mg
178mg
40%
Copper
0.03mg
0.383mg
39%
Vitamin A
330µg
0µg
37%
Zinc
3.64mg
7.47mg
35%
Cholesterol
99mg
0mg
33%
Calcium
710mg
383mg
33%
Potassium
76mg
1119mg
31%
Sodium
653mg
18mg
28%
Protein
22.87g
10.76g
24%
Vitamin C
0mg
21mg
23%
Carbs
3.09g
68.47g
22%
Monounsaturated fat
9.246g
0.87g
21%
Vitamin B2
0.428mg
0.182mg
19%
Vitamin B1
0.029mg
0.198mg
14%
Vitamin B6
0.066mg
0.23mg
13%
Vitamin B5
0.41mg
8%
Vitamin B3
0.059mg
1.102mg
7%
Folate
27µg
7%
Polyunsaturated fat
1.421g
0.43g
7%
Calories
404kcal
311kcal
5%
Vitamin E
0.71mg
5%
Vitamin D*
24 IU
0 IU
3%
Vitamin D
0.6µg
0µg
3%
Choline
16.5mg
3%
Vitamin K
2.4µg
2%
Protein per 100 calories
5.7g
3.5g
N/A
Calories per 10 g protein
177kcal
289kcal
N/A
Weight per 100 calories
25g
32g
N/A
Unsaturated / Saturated Fat ratio
0.57
1.9
N/A
Net carbs
3.09g
40.47g
N/A
Sugar
0.48g
N/A
Trans fat
0.917g
0g
N/A
Tryptophan
0.547mg
0%
Threonine
1.044mg
0%
Isoleucine
1.206mg
0%
Leucine
1.939mg
0%
Lysine
1.025mg
0%
Methionine
0.547mg
0%
Phenylalanine
1.074mg
0%
Valine
1.404mg
0%
Histidine
0.547mg
0%
Omega-3 - EPA
0.01g
N/A
Omega-3 - DHA
0.001g
N/A
Omega-3 - DPA
0.017g
N/A
Omega-6 - Eicosadienoic acid
0.007g
N/A
Macronutrient Comparison
Macronutrient breakdown side-by-side comparison
3
23%
33%
3%
37%
4%
Protein:
22.87 g
Fats:
33.31 g
Carbs:
3.09 g
Water:
37.02 g
Other:
3.71 g
2
11%
7%
68%
8%
6%
Protein:
10.76 g
Fats:
6.7 g
Carbs:
68.47 g
Water:
8.28 g
Other:
5.79 g
Contains
more
Protein Protein
+112.5%
Contains
more
Fats Fats
+397.2%
Contains
more
Water Water
+347.1%
Contains
more
Carbs Carbs
+2115.9%
Contains
more
Other Other
+56.1%
Fat Type Comparison
Fat type breakdown side-by-side comparison
2
64%
31%
5%
Saturated fat:
Sat. Fat
18.867 g
Monounsaturated fat:
Mono. Fat
9.246 g
Polyunsaturated fat:
Poly. Fat
1.421 g
1
34%
44%
22%
Saturated fat:
Sat. Fat
0.68 g
Monounsaturated fat:
Mono. Fat
0.87 g
Polyunsaturated fat:
Poly. Fat
0.43 g
Contains
more
Mono. Fat Monounsaturated fat
+962.8%
Contains
more
Poly. Fat Polyunsaturated fat
+230.5%
Contains
less
Sat. Fat Saturated fat
-96.4%