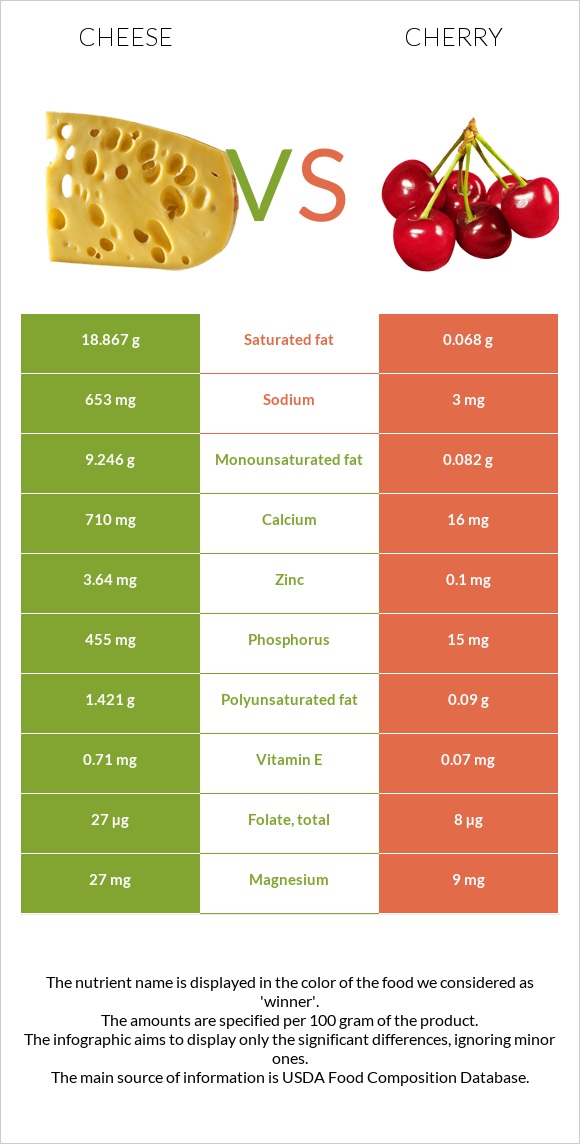
Important differences between cheese and cherries Cheese has more calcium, phosphorus, selenium, vitamin B12, zinc, and vitamin B2; however, cherries have more vitamin C. Cheese's daily need coverage for saturated fat is 94% more. Cherries are lower in cholesterol. Cherries have a higher glycemic index than cheese. The food varieties used in the comparison are Cheese, cheddar and Cherries, sour, red, raw .
Infographic
Mineral Comparison
Mineral comparison score is based on the number of minerals by which one or the other food is richer. The "coverage" charts below show how much of the daily needs can be covered by 300 grams of the food.
5
100 g
300 g
1 cubic inch - 17g 1 slice (1 oz) - 28g 1 oz - 28.35g 1 cup, shredded - 113g 1 cup, diced - 132g 1 cup, melted - 244g
Magnesium
Magnesium
Calcium
Calcium
Potassium
Potassium
Iron
Iron
Copper
Copper
Zinc
Zinc
Phosphorus
Phosphorus
Sodium
Sodium
Manganese
Manganese
Selenium
Selenium
19%
213%
6.7%
5.3%
10%
99%
195%
85%
3.5%
155%
5
100 g
300 g
1 cup, with pits, yields - 103g 1 cup, without pits - 155g
Magnesium
Magnesium
Calcium
Calcium
Potassium
Potassium
Iron
Iron
Copper
Copper
Zinc
Zinc
Phosphorus
Phosphorus
Sodium
Sodium
Manganese
Manganese
Selenium
Selenium
6.4%
4.8%
15%
12%
35%
2.7%
6.4%
0.39%
15%
0%
Vitamin Comparison
Vitamin comparison score is based on the number of vitamins by which one or the other food is richer. The "coverage" charts below show how much of the daily needs can be covered by 300 grams of the food.
9
100 g
300 g
1 cubic inch - 17g 1 slice (1 oz) - 28g 1 oz - 28.35g 1 cup, shredded - 113g 1 cup, diced - 132g 1 cup, melted - 244g
Vitamin C
Vit. C
Vitamin D
Vit. D
Vitamin A
Vit. A
Vitamin E
Vit. E
Vitamin B1
Vit. B1
Vitamin B2
Vit. B2
Vitamin B3
Vit. B3
Vitamin B5
Vit. B5
Vitamin B6
Vit. B6
Vitamin B12
Vit. B12
Vitamin K
Vit. K
Folate
Folate
0%
9%
110%
14%
7.3%
99%
1.1%
25%
15%
138%
6%
20%
2
100 g
300 g
1 cup, with pits, yields - 103g 1 cup, without pits - 155g
Vitamin C
Vit. C
Vitamin D
Vit. D
Vitamin A
Vit. A
Vitamin E
Vit. E
Vitamin B1
Vit. B1
Vitamin B2
Vit. B2
Vitamin B3
Vit. B3
Vitamin B5
Vit. B5
Vitamin B6
Vit. B6
Vitamin B12
Vit. B12
Vitamin K
Vit. K
Folate
Folate
33%
0%
21%
1.4%
7.5%
9.2%
7.5%
8.6%
10%
0%
5.3%
6%
All nutrients comparison - raw data values
Nutrient
DV% diff.
Saturated fat
18.867g
0.068g
85%
Calcium
710mg
16mg
69%
Phosphorus
455mg
15mg
63%
Selenium
28.5µg
0µg
52%
Fats
33.31g
0.3g
51%
Vitamin B12
1.1µg
0µg
46%
Protein
22.87g
1g
44%
Cholesterol
99mg
0mg
33%
Zinc
3.64mg
0.1mg
32%
Vitamin A
330µg
64µg
30%
Vitamin B2
0.428mg
0.04mg
30%
Sodium
653mg
3mg
28%
Monounsaturated fat
9.246g
0.082g
23%
Calories
404kcal
50kcal
18%
Vitamin C
0mg
10mg
11%
Polyunsaturated fat
1.421g
0.09g
9%
Copper
0.03mg
0.104mg
8%
Fiber
0g
1.6g
6%
Vitamin B5
0.41mg
0.143mg
5%
Folate
27µg
8µg
5%
Magnesium
27mg
9mg
4%
Vitamin E
0.71mg
0.07mg
4%
Manganese
0.027mg
0.112mg
4%
Fructose
0g
3.51g
4%
Carbs
3.09g
12.18g
3%
Vitamin D*
24 IU
0 IU
3%
Vitamin D
0.6µg
0µg
3%
Potassium
76mg
173mg
3%
Iron
0.14mg
0.32mg
2%
Vitamin B3
0.059mg
0.4mg
2%
Vitamin B6
0.066mg
0.044mg
2%
Choline
16.5mg
6.1mg
2%
Protein per 100 calories
5.7g
2g
N/A
Calories per 10 g protein
177kcal
500kcal
N/A
Weight per 100 calories
25g
200g
N/A
Unsaturated / Saturated Fat ratio
0.57
2.5
N/A
Net carbs
3.09g
10.58g
N/A
Sugar
0.48g
8.49g
N/A
Vitamin B1
0.029mg
0.03mg
0%
Vitamin K
2.4µg
2.1µg
0%
Trans fat
0.917g
0g
N/A
Tryptophan
0.547mg
0%
Threonine
1.044mg
0%
Isoleucine
1.206mg
0%
Leucine
1.939mg
0%
Lysine
1.025mg
0%
Methionine
0.547mg
0%
Phenylalanine
1.074mg
0%
Valine
1.404mg
0%
Histidine
0.547mg
0%
Omega-3 - EPA
0.01g
0g
N/A
Omega-3 - DHA
0.001g
0g
N/A
Omega-3 - DPA
0.017g
0g
N/A
Omega-6 - Eicosadienoic acid
0.007g
N/A
Macronutrient Comparison
Macronutrient breakdown side-by-side comparison
3
23%
33%
3%
37%
4%
Protein:
22.87 g
Fats:
33.31 g
Carbs:
3.09 g
Water:
37.02 g
Other:
3.71 g
2
12%
86%
Protein:
1 g
Fats:
0.3 g
Carbs:
12.18 g
Water:
86.13 g
Other:
0.39 g
Contains
more
Protein Protein
+2187%
Contains
more
Fats Fats
+11003.3%
Contains
more
Other Other
+851.3%
Contains
more
Carbs Carbs
+294.2%
Contains
more
Water Water
+132.7%
Fat Type Comparison
Fat type breakdown side-by-side comparison
2
64%
31%
5%
Saturated fat:
Sat. Fat
18.867 g
Monounsaturated fat:
Mono. Fat
9.246 g
Polyunsaturated fat:
Poly. Fat
1.421 g
1
28%
34%
38%
Saturated fat:
Sat. Fat
0.068 g
Monounsaturated fat:
Mono. Fat
0.082 g
Polyunsaturated fat:
Poly. Fat
0.09 g
Contains
more
Mono. Fat Monounsaturated fat
+11175.6%
Contains
more
Poly. Fat Polyunsaturated fat
+1478.9%
Contains
less
Sat. Fat Saturated fat
-99.6%
Carbohydrate type comparison
Carbohydrate type breakdown side-by-side comparison
2
54%
25%
21%
Starch:
0 g
Sucrose:
0 g
Glucose:
0.26 g
Fructose:
0 g
Lactose:
0.12 g
Maltose:
0 g
Galactose:
0.1 g
3
9%
49%
41%
Starch:
0 g
Sucrose:
0.8 g
Glucose:
4.18 g
Fructose:
3.51 g
Lactose:
0 g
Maltose:
0 g
Galactose:
0 g
Contains
more
Lactose Lactose
+∞%
Contains
more
Galactose Galactose
+∞%
Contains
more
Sucrose Sucrose
+∞%
Contains
more
Glucose Glucose
+1507.7%
Contains
more
Fructose Fructose
+∞%
~equal in
Starch
~0g
~equal in
Maltose
~0g