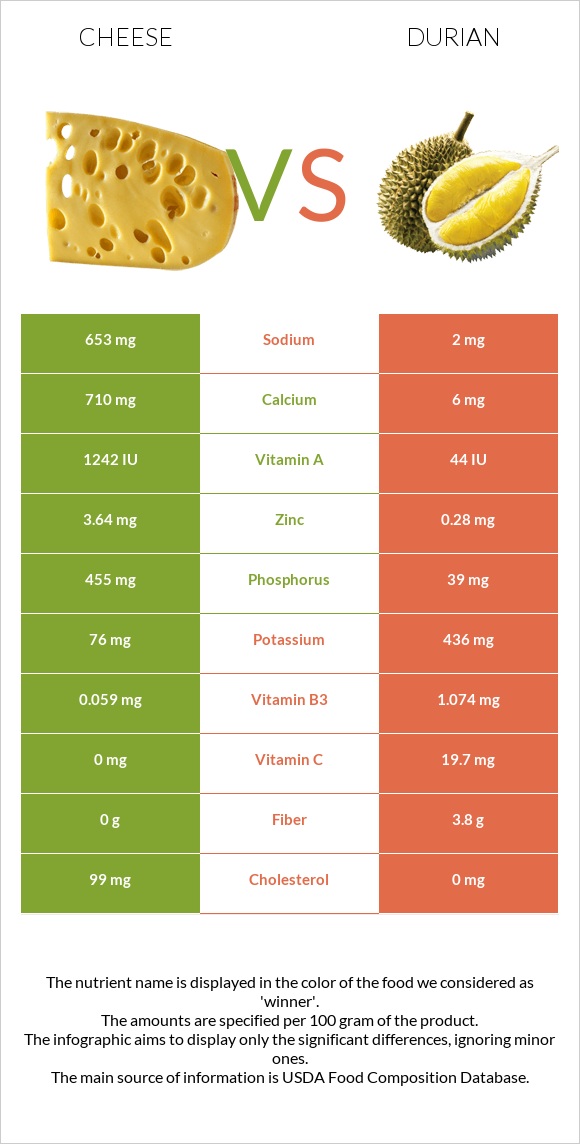
Differences between cheese and durian Cheese has more calcium, phosphorus, vitamin B12, zinc, and vitamin A, while durian has more vitamin B1, vitamin C, and copper. Cheese's daily need coverage for calcium is 70% higher. The amount of cholesterol in durian is lower. Cheese has a lower glycemic index. The glycemic index of cheese is 0, while the glycemic index of durian is 49. The food types used in this comparison are Cheese, cheddar and Durian, raw or frozen .
Infographic
Mineral Comparison
Mineral comparison score is based on the number of minerals by which one or the other food is richer. The "coverage" charts below show how much of the daily needs can be covered by 300 grams of the food.
4
100 g
300 g
1 cubic inch - 17g 1 slice (1 oz) - 28g 1 oz - 28.35g 1 cup, shredded - 113g 1 cup, diced - 132g 1 cup, melted - 244g
Magnesium
Magnesium
Calcium
Calcium
Potassium
Potassium
Iron
Iron
Copper
Copper
Zinc
Zinc
Phosphorus
Phosphorus
Sodium
Sodium
Manganese
Manganese
Selenium
Selenium
19%
213%
6.7%
5.3%
10%
99%
195%
85%
3.5%
155%
6
100 g
300 g
1 cup, chopped or diced - 243g 1 fruit - 602g
Magnesium
Magnesium
Calcium
Calcium
Potassium
Potassium
Iron
Iron
Copper
Copper
Zinc
Zinc
Phosphorus
Phosphorus
Sodium
Sodium
Manganese
Manganese
Selenium
Selenium
21%
1.8%
38%
16%
69%
7.6%
17%
0.26%
42%
0%
Vitamin Comparison
Vitamin comparison score is based on the number of vitamins by which one or the other food is richer. The "coverage" charts below show how much of the daily needs can be covered by 300 grams of the food.
7
100 g
300 g
1 cubic inch - 17g 1 slice (1 oz) - 28g 1 oz - 28.35g 1 cup, shredded - 113g 1 cup, diced - 132g 1 cup, melted - 244g
Vitamin C
Vit. C
Vitamin D
Vit. D
Vitamin A
Vit. A
Vitamin E
Vit. E
Vitamin B1
Vit. B1
Vitamin B2
Vit. B2
Vitamin B3
Vit. B3
Vitamin B5
Vit. B5
Vitamin B6
Vit. B6
Vitamin B12
Vit. B12
Vitamin K
Vit. K
Folate
Folate
0%
9%
110%
14%
7.3%
99%
1.1%
25%
15%
138%
6%
20%
5
100 g
300 g
1 cup, chopped or diced - 243g 1 fruit - 602g
Vitamin C
Vit. C
Vitamin D
Vit. D
Vitamin A
Vit. A
Vitamin E
Vit. E
Vitamin B1
Vit. B1
Vitamin B2
Vit. B2
Vitamin B3
Vit. B3
Vitamin B5
Vit. B5
Vitamin B6
Vit. B6
Vitamin B12
Vit. B12
Vitamin K
Vit. K
Folate
Folate
66%
0%
0.67%
0%
94%
46%
20%
14%
73%
0%
0%
27%
All nutrients comparison - raw data values
Nutrient
DV% diff.
Saturated fat
18.867g
86%
Calcium
710mg
6mg
70%
Phosphorus
455mg
39mg
59%
Selenium
28.5µg
52%
Vitamin B12
1.1µg
0µg
46%
Protein
22.87g
1.47g
43%
Fats
33.31g
5.33g
43%
Vitamin A
330µg
2µg
36%
Cholesterol
99mg
0mg
33%
Zinc
3.64mg
0.28mg
31%
Vitamin B1
0.029mg
0.374mg
29%
Sodium
653mg
2mg
28%
Monounsaturated fat
9.246g
23%
Vitamin C
0mg
19.7mg
22%
Copper
0.03mg
0.207mg
20%
Vitamin B6
0.066mg
0.316mg
19%
Vitamin B2
0.428mg
0.2mg
18%
Fiber
0g
3.8g
15%
Calories
404kcal
147kcal
13%
Manganese
0.027mg
0.325mg
13%
Potassium
76mg
436mg
11%
Polyunsaturated fat
1.421g
9%
Carbs
3.09g
27.09g
8%
Vitamin B3
0.059mg
1.074mg
6%
Vitamin E
0.71mg
5%
Iron
0.14mg
0.43mg
4%
Vitamin B5
0.41mg
0.23mg
4%
Vitamin D*
24 IU
3%
Vitamin D
0.6µg
3%
Choline
16.5mg
3%
Vitamin K
2.4µg
2%
Folate
27µg
36µg
2%
Magnesium
27mg
30mg
1%
Protein per 100 calories
5.7g
1g
N/A
Calories per 10 g protein
177kcal
1000kcal
N/A
Weight per 100 calories
25g
68g
N/A
Unsaturated / Saturated Fat ratio
0.57
N/A
Net carbs
3.09g
23.29g
N/A
Sugar
0.48g
N/A
Trans fat
0.917g
0g
N/A
Tryptophan
0.547mg
0%
Threonine
1.044mg
0%
Isoleucine
1.206mg
0%
Leucine
1.939mg
0%
Lysine
1.025mg
0%
Methionine
0.547mg
0%
Phenylalanine
1.074mg
0%
Valine
1.404mg
0%
Histidine
0.547mg
0%
Omega-3 - EPA
0.01g
N/A
Omega-3 - DHA
0.001g
N/A
Omega-3 - DPA
0.017g
N/A
Omega-6 - Eicosadienoic acid
0.007g
N/A
Macronutrient Comparison
Macronutrient breakdown side-by-side comparison
3
23%
33%
3%
37%
4%
Protein:
22.87 g
Fats:
33.31 g
Carbs:
3.09 g
Water:
37.02 g
Other:
3.71 g
2
5%
27%
65%
Protein:
1.47 g
Fats:
5.33 g
Carbs:
27.09 g
Water:
64.99 g
Other:
1.12 g
Contains
more
Protein Protein
+1455.8%
Contains
more
Fats Fats
+525%
Contains
more
Other Other
+231.3%
Contains
more
Carbs Carbs
+776.7%
Contains
more
Water Water
+75.6%