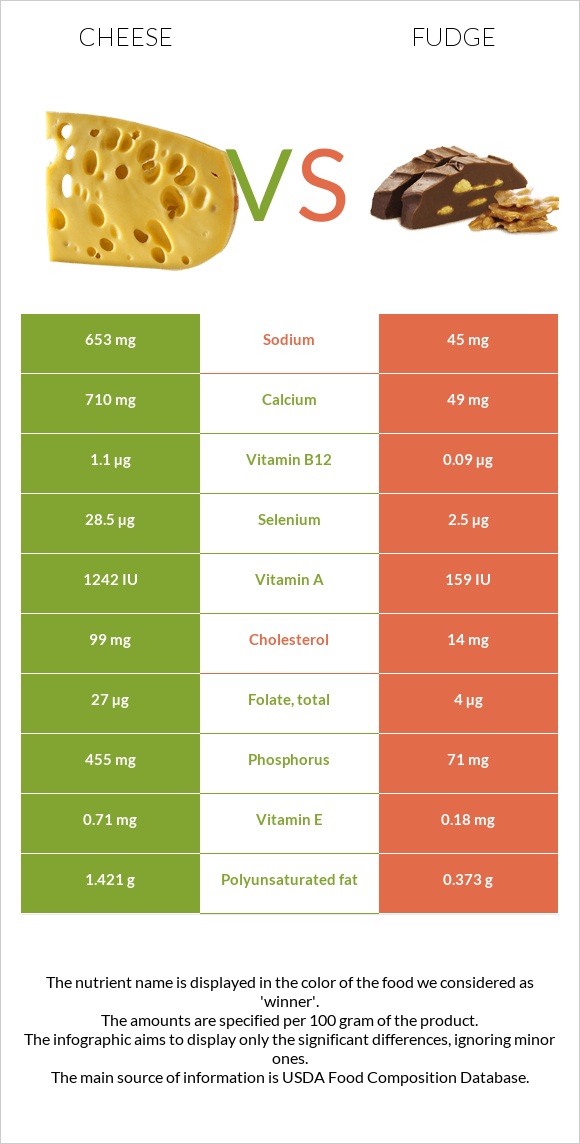
How are cheese and fudge different? Cheese is higher in calcium, phosphorus, selenium, vitamin B12, vitamin B2, and zinc; however, fudge is richer in copper. Daily need coverage for calcium for cheese is 66% higher. Cheese contains 15 times more sodium than fudge. While cheese contains 653mg of sodium, fudge contains only 45mg. Cheese has a lower glycemic index (0) than fudge (49). Cheese, cheddar and Candies, fudge, chocolate, prepared-from-recipe are the varieties used in this article.
Infographic
Mineral Comparison
Mineral comparison score is based on the number of minerals by which one or the other food is richer. The "coverage" charts below show how much of the daily needs can be covered by 300 grams of the food.
4
100 g
300 g
1 cubic inch - 17g 1 slice (1 oz) - 28g 1 oz - 28.35g 1 cup, shredded - 113g 1 cup, diced - 132g 1 cup, melted - 244g
Magnesium
Magnesium
Calcium
Calcium
Potassium
Potassium
Iron
Iron
Copper
Copper
Zinc
Zinc
Phosphorus
Phosphorus
Sodium
Sodium
Manganese
Manganese
Selenium
Selenium
19%
213%
6.7%
5.3%
10%
99%
195%
85%
3.5%
155%
6
100 g
300 g
1 piece - 17g
Magnesium
Magnesium
Calcium
Calcium
Potassium
Potassium
Iron
Iron
Copper
Copper
Zinc
Zinc
Phosphorus
Phosphorus
Sodium
Sodium
Manganese
Manganese
Selenium
Selenium
26%
15%
12%
66%
110%
30%
30%
5.9%
55%
14%
Vitamin Comparison
Vitamin comparison score is based on the number of vitamins by which one or the other food is richer. The "coverage" charts below show how much of the daily needs can be covered by 300 grams of the food.
10
100 g
300 g
1 cubic inch - 17g 1 slice (1 oz) - 28g 1 oz - 28.35g 1 cup, shredded - 113g 1 cup, diced - 132g 1 cup, melted - 244g
Vitamin C
Vit. C
Vitamin D
Vit. D
Vitamin A
Vit. A
Vitamin E
Vit. E
Vitamin B1
Vit. B1
Vitamin B2
Vit. B2
Vitamin B3
Vit. B3
Vitamin B5
Vit. B5
Vitamin B6
Vit. B6
Vitamin B12
Vit. B12
Vitamin K
Vit. K
Folate
Folate
0%
9%
110%
14%
7.3%
99%
1.1%
25%
15%
138%
6%
20%
1
100 g
300 g
1 piece - 17g
Vitamin C
Vit. C
Vitamin D
Vit. D
Vitamin A
Vit. A
Vitamin E
Vit. E
Vitamin B1
Vit. B1
Vitamin B2
Vit. B2
Vitamin B3
Vit. B3
Vitamin B5
Vit. B5
Vitamin B6
Vit. B6
Vitamin B12
Vit. B12
Vitamin K
Vit. K
Folate
Folate
0%
0%
15%
3.6%
6.5%
20%
3.3%
8.4%
2.8%
11%
3.5%
3%
All nutrients comparison - raw data values
Nutrient
DV% diff.
Calcium
710mg
49mg
66%
Saturated fat
18.867g
6.448g
56%
Phosphorus
455mg
71mg
55%
Selenium
28.5µg
2.5µg
47%
Vitamin B12
1.1µg
0.09µg
42%
Protein
22.87g
2.39g
41%
Fats
33.31g
10.41g
35%
Copper
0.03mg
0.329mg
33%
Vitamin A
330µg
44µg
32%
Cholesterol
99mg
14mg
28%
Sodium
653mg
45mg
26%
Vitamin B2
0.428mg
0.085mg
26%
Carbs
3.09g
76.44g
24%
Zinc
3.64mg
1.11mg
23%
Iron
0.14mg
1.77mg
20%
Manganese
0.027mg
0.422mg
17%
Monounsaturated fat
9.246g
2.943g
16%
Fiber
0g
1.7g
7%
Polyunsaturated fat
1.421g
0.373g
7%
Folate
27µg
4µg
6%
Vitamin B5
0.41mg
0.14mg
5%
Vitamin E
0.71mg
0.18mg
4%
Vitamin B6
0.066mg
0.012mg
4%
Vitamin D*
24 IU
0 IU
3%
Vitamin D
0.6µg
0µg
3%
Magnesium
27mg
36mg
2%
Potassium
76mg
134mg
2%
Caffeine
0mg
8mg
2%
Vitamin B3
0.059mg
0.176mg
1%
Vitamin K
2.4µg
1.4µg
1%
Choline
16.5mg
10mg
1%
Calories
404kcal
411kcal
0%
Protein per 100 calories
5.7g
0.58g
N/A
Calories per 10 g protein
177kcal
1720kcal
N/A
Weight per 100 calories
25g
24g
N/A
Unsaturated / Saturated Fat ratio
0.57
0.51
N/A
Net carbs
3.09g
74.74g
N/A
Sugar
0.48g
73.12g
N/A
Vitamin B1
0.029mg
0.026mg
0%
Trans fat
0.917g
0.165g
N/A
Tryptophan
0.547mg
0%
Threonine
1.044mg
0%
Isoleucine
1.206mg
0%
Leucine
1.939mg
0%
Lysine
1.025mg
0%
Methionine
0.547mg
0%
Phenylalanine
1.074mg
0%
Valine
1.404mg
0%
Histidine
0.547mg
0%
Omega-3 - EPA
0.01g
0g
N/A
Omega-3 - DHA
0.001g
0g
N/A
Omega-3 - DPA
0.017g
0g
N/A
Omega-6 - Eicosadienoic acid
0.007g
0g
N/A
Macronutrient Comparison
Macronutrient breakdown side-by-side comparison
4
23%
33%
3%
37%
4%
Protein:
22.87 g
Fats:
33.31 g
Carbs:
3.09 g
Water:
37.02 g
Other:
3.71 g
1
2%
10%
76%
10%
Protein:
2.39 g
Fats:
10.41 g
Carbs:
76.44 g
Water:
9.81 g
Other:
0.95 g
Contains
more
Protein Protein
+856.9%
Contains
more
Fats Fats
+220%
Contains
more
Water Water
+277.4%
Contains
more
Other Other
+290.5%
Contains
more
Carbs Carbs
+2373.8%
Fat Type Comparison
Fat type breakdown side-by-side comparison
2
64%
31%
5%
Saturated fat:
Sat. Fat
18.867 g
Monounsaturated fat:
Mono. Fat
9.246 g
Polyunsaturated fat:
Poly. Fat
1.421 g
1
66%
30%
4%
Saturated fat:
Sat. Fat
6.448 g
Monounsaturated fat:
Mono. Fat
2.943 g
Polyunsaturated fat:
Poly. Fat
0.373 g
Contains
more
Mono. Fat Monounsaturated fat
+214.2%
Contains
more
Poly. Fat Polyunsaturated fat
+281%
Contains
less
Sat. Fat Saturated fat
-65.8%