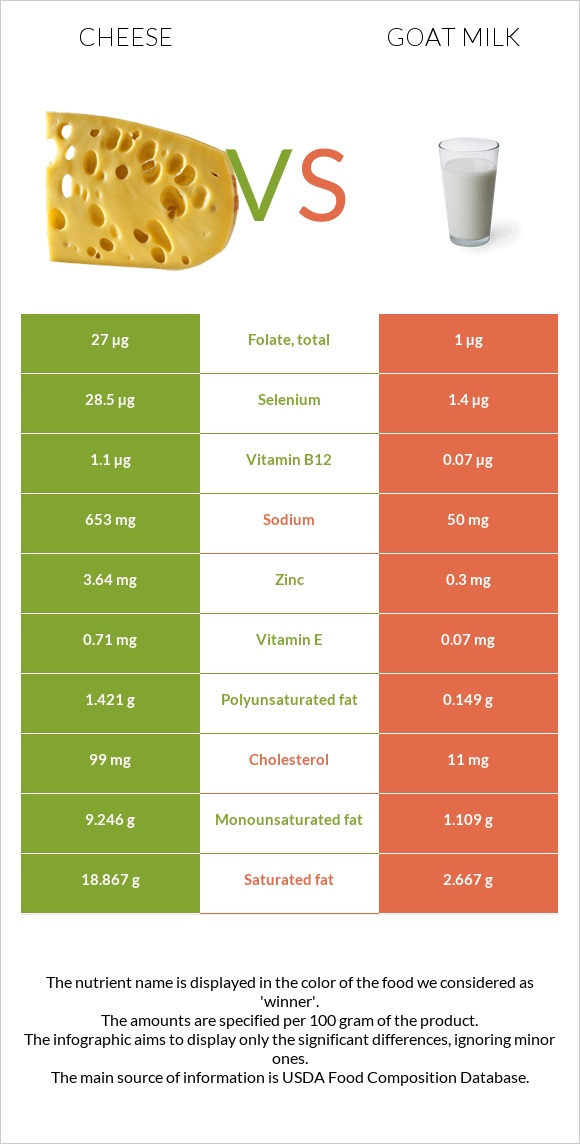
A recap on the differences between cheese and goat milk Cheese is higher than goat milk in calcium, selenium, phosphorus, vitamin B12, zinc, vitamin B2, and vitamin A. Cheese covers your daily saturated fat needs 81% more than goat milk. Cheese contains 20 times more selenium than goat milk. While cheese contains 28.5µg of selenium, goat milk contains only 1.4µg. The amount of sodium in goat milk is lower. The glycemic index of cheese is lower. Food varieties used in this article are Cheese, cheddar and Milk, goat, fluid, with added vitamin D .
Infographic
Mineral Comparison
Mineral comparison score is based on the number of minerals by which one or the other food is richer. The "coverage" charts below show how much of the daily needs can be covered by 300 grams of the food.
7
100 g
300 g
1 cubic inch - 17g 1 slice (1 oz) - 28g 1 oz - 28.35g 1 cup, shredded - 113g 1 cup, diced - 132g 1 cup, melted - 244g
Magnesium
Magnesium
Calcium
Calcium
Potassium
Potassium
Iron
Iron
Copper
Copper
Zinc
Zinc
Phosphorus
Phosphorus
Sodium
Sodium
Manganese
Manganese
Selenium
Selenium
19%
213%
6.7%
5.3%
10%
99%
195%
85%
3.5%
155%
3
100 g
300 g
1 fl oz - 30.5g 1 cup - 244g 1 quart - 976g
Magnesium
Magnesium
Calcium
Calcium
Potassium
Potassium
Iron
Iron
Copper
Copper
Zinc
Zinc
Phosphorus
Phosphorus
Sodium
Sodium
Manganese
Manganese
Selenium
Selenium
10%
40%
18%
1.9%
15%
8.2%
48%
6.5%
2.3%
7.6%
Vitamin Comparison
Vitamin comparison score is based on the number of vitamins by which one or the other food is richer. The "coverage" charts below show how much of the daily needs can be covered by 300 grams of the food.
8
100 g
300 g
1 cubic inch - 17g 1 slice (1 oz) - 28g 1 oz - 28.35g 1 cup, shredded - 113g 1 cup, diced - 132g 1 cup, melted - 244g
Vitamin C
Vit. C
Vitamin D
Vit. D
Vitamin A
Vit. A
Vitamin E
Vit. E
Vitamin B1
Vit. B1
Vitamin B2
Vit. B2
Vitamin B3
Vit. B3
Vitamin B5
Vit. B5
Vitamin B6
Vit. B6
Vitamin B12
Vit. B12
Vitamin K
Vit. K
Folate
Folate
0%
9%
110%
14%
7.3%
99%
1.1%
25%
15%
138%
6%
20%
4
100 g
300 g
1 fl oz - 30.5g 1 cup - 244g 1 quart - 976g
Vitamin C
Vit. C
Vitamin D
Vit. D
Vitamin A
Vit. A
Vitamin E
Vit. E
Vitamin B1
Vit. B1
Vitamin B2
Vit. B2
Vitamin B3
Vit. B3
Vitamin B5
Vit. B5
Vitamin B6
Vit. B6
Vitamin B12
Vit. B12
Vitamin K
Vit. K
Folate
Folate
4.3%
20%
19%
1.4%
12%
32%
5.2%
19%
11%
8.8%
0.75%
0.75%
All nutrients comparison - raw data values
Nutrient
DV% diff.
Saturated fat
18.867g
2.667g
74%
Calcium
710mg
134mg
58%
Phosphorus
455mg
111mg
49%
Selenium
28.5µg
1.4µg
49%
Fats
33.31g
4.14g
45%
Vitamin B12
1.1µg
0.07µg
43%
Protein
22.87g
3.56g
39%
Zinc
3.64mg
0.3mg
30%
Vitamin A
330µg
57µg
30%
Cholesterol
99mg
11mg
29%
Sodium
653mg
50mg
26%
Vitamin B2
0.428mg
0.138mg
22%
Monounsaturated fat
9.246g
1.109g
20%
Calories
404kcal
69kcal
17%
Polyunsaturated fat
1.421g
0.149g
8%
Folate
27µg
1µg
7%
Vitamin D
0.6µg
1.3µg
4%
Potassium
76mg
204mg
4%
Vitamin E
0.71mg
0.07mg
4%
Vitamin D*
24 IU
51 IU
3%
Magnesium
27mg
14mg
3%
Copper
0.03mg
0.046mg
2%
Vitamin B1
0.029mg
0.048mg
2%
Vitamin B5
0.41mg
0.31mg
2%
Vitamin B6
0.066mg
0.046mg
2%
Vitamin K
2.4µg
0.3µg
2%
Vitamin C
0mg
1.3mg
1%
Iron
0.14mg
0.05mg
1%
Vitamin B3
0.059mg
0.277mg
1%
Protein per 100 calories
5.7g
5.2g
N/A
Calories per 10 g protein
177kcal
194kcal
N/A
Weight per 100 calories
25g
145g
N/A
Unsaturated / Saturated Fat ratio
0.57
0.47
N/A
Net carbs
3.09g
4.45g
N/A
Carbs
3.09g
4.45g
0%
Sugar
0.48g
4.45g
N/A
Manganese
0.027mg
0.018mg
0%
Trans fat
0.917g
N/A
Choline
16.5mg
16mg
0%
Tryptophan
0.547mg
0.044mg
0%
Threonine
1.044mg
0.163mg
0%
Isoleucine
1.206mg
0.207mg
0%
Leucine
1.939mg
0.314mg
0%
Lysine
1.025mg
0.29mg
0%
Methionine
0.547mg
0.08mg
0%
Phenylalanine
1.074mg
0.155mg
0%
Valine
1.404mg
0.24mg
0%
Histidine
0.547mg
0.089mg
0%
Omega-3 - EPA
0.01g
0g
N/A
Omega-3 - DHA
0.001g
0g
N/A
Omega-3 - DPA
0.017g
0g
N/A
Omega-6 - Eicosadienoic acid
0.007g
N/A
Macronutrient Comparison
Macronutrient breakdown side-by-side comparison
3
23%
33%
3%
37%
4%
Protein:
22.87 g
Fats:
33.31 g
Carbs:
3.09 g
Water:
37.02 g
Other:
3.71 g
2
4%
4%
4%
87%
Protein:
3.56 g
Fats:
4.14 g
Carbs:
4.45 g
Water:
87.03 g
Other:
0.82 g
Contains
more
Protein Protein
+542.4%
Contains
more
Fats Fats
+704.6%
Contains
more
Other Other
+352.4%
Contains
more
Carbs Carbs
+44%
Contains
more
Water Water
+135.1%
Fat Type Comparison
Fat type breakdown side-by-side comparison
2
64%
31%
5%
Saturated fat:
Sat. Fat
18.867 g
Monounsaturated fat:
Mono. Fat
9.246 g
Polyunsaturated fat:
Poly. Fat
1.421 g
1
68%
28%
4%
Saturated fat:
Sat. Fat
2.667 g
Monounsaturated fat:
Mono. Fat
1.109 g
Polyunsaturated fat:
Poly. Fat
0.149 g
Contains
more
Mono. Fat Monounsaturated fat
+733.7%
Contains
more
Poly. Fat Polyunsaturated fat
+853.7%
Contains
less
Sat. Fat Saturated fat
-85.9%