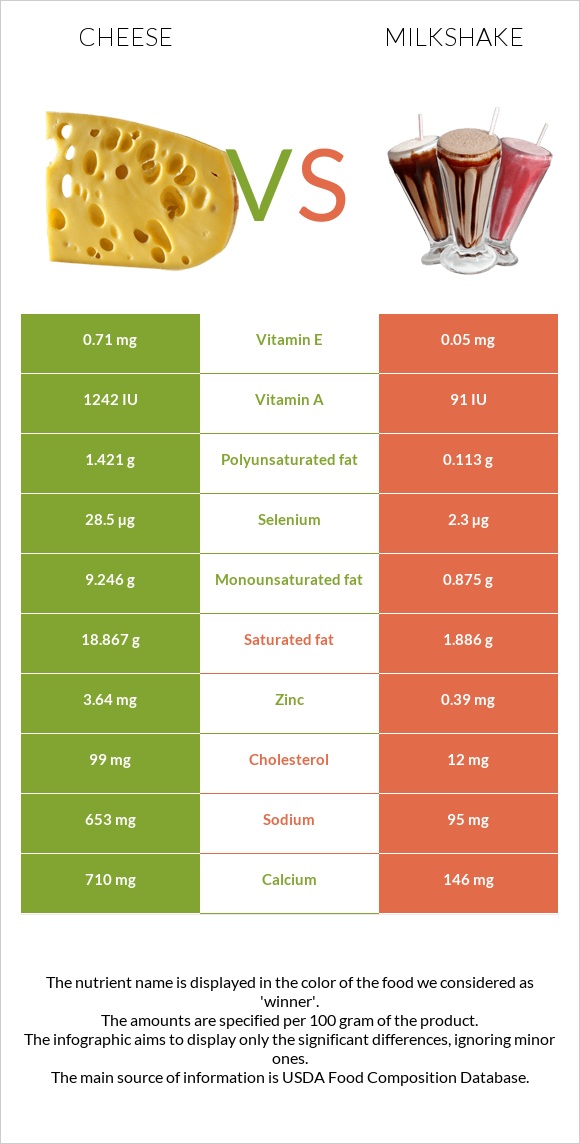
Significant differences between cheese and milkshake The amount of calcium, phosphorus, selenium, zinc, vitamin B12, vitamin A, and vitamin B2 in cheese is higher than in milkshake. Cheese covers your daily saturated fat needs 85% more than milkshake. Milkshake has 14 times less vitamin A than cheese. Cheese has 1242 IU of vitamin A, while milkshake has 91 IU. Milkshake contains less saturated fat. Milkshake has a higher glycemic index. The glycemic index of milkshake is 27, while the glycemic index of cheese is 0. Specific food types used in this comparison are Cheese, cheddar and Milk shakes, thick vanilla .
Infographic
Mineral Comparison
Mineral comparison score is based on the number of minerals by which one or the other food is richer. The "coverage" charts below show how much of the daily needs can be covered by 300 grams of the food.
7
100 g
300 g
1 cubic inch - 17g 1 slice (1 oz) - 28g 1 oz - 28.35g 1 cup, shredded - 113g 1 cup, diced - 132g 1 cup, melted - 244g
Magnesium
Magnesium
Calcium
Calcium
Potassium
Potassium
Iron
Iron
Copper
Copper
Zinc
Zinc
Phosphorus
Phosphorus
Sodium
Sodium
Manganese
Manganese
Selenium
Selenium
19%
213%
6.7%
5.3%
10%
99%
195%
85%
3.5%
155%
3
100 g
300 g
1 fl oz - 28.4g 1 container (11 oz) - 313g
Magnesium
Magnesium
Calcium
Calcium
Potassium
Potassium
Iron
Iron
Copper
Copper
Zinc
Zinc
Phosphorus
Phosphorus
Sodium
Sodium
Manganese
Manganese
Selenium
Selenium
8.6%
44%
16%
3.8%
17%
11%
49%
12%
1.8%
13%
Vitamin Comparison
Vitamin comparison score is based on the number of vitamins by which one or the other food is richer. The "coverage" charts below show how much of the daily needs can be covered by 300 grams of the food.
8
100 g
300 g
1 cubic inch - 17g 1 slice (1 oz) - 28g 1 oz - 28.35g 1 cup, shredded - 113g 1 cup, diced - 132g 1 cup, melted - 244g
Vitamin C
Vit. C
Vitamin D
Vit. D
Vitamin A
Vit. A
Vitamin E
Vit. E
Vitamin B1
Vit. B1
Vitamin B2
Vit. B2
Vitamin B3
Vit. B3
Vitamin B5
Vit. B5
Vitamin B6
Vit. B6
Vitamin B12
Vit. B12
Vitamin K
Vit. K
Folate
Folate
0%
9%
110%
14%
7.3%
99%
1.1%
25%
15%
138%
6%
20%
2
100 g
300 g
1 fl oz - 28.4g 1 container (11 oz) - 313g
Vitamin C
Vit. C
Vitamin D
Vit. D
Vitamin A
Vit. A
Vitamin E
Vit. E
Vitamin B1
Vit. B1
Vitamin B2
Vit. B2
Vitamin B3
Vit. B3
Vitamin B5
Vit. B5
Vitamin B6
Vit. B6
Vitamin B12
Vit. B12
Vitamin K
Vit. K
Folate
Folate
0%
18%
8.3%
1%
7.5%
45%
2.7%
22%
9.7%
65%
0.5%
5.3%
All nutrients comparison - raw data values
Nutrient
DV% diff.
Saturated fat
18.867g
1.886g
77%
Calcium
710mg
146mg
56%
Phosphorus
455mg
115mg
49%
Selenium
28.5µg
2.3µg
48%
Fats
33.31g
3.03g
47%
Protein
22.87g
3.86g
38%
Vitamin A
330µg
25µg
34%
Zinc
3.64mg
0.39mg
30%
Cholesterol
99mg
12mg
29%
Sodium
653mg
95mg
24%
Vitamin B12
1.1µg
0.52µg
24%
Monounsaturated fat
9.246g
0.875g
21%
Vitamin B2
0.428mg
0.195mg
18%
Calories
404kcal
112kcal
15%
Polyunsaturated fat
1.421g
0.113g
9%
Carbs
3.09g
17.75g
5%
Folate
27µg
7µg
5%
Magnesium
27mg
12mg
4%
Vitamin E
0.71mg
0.05mg
4%
Vitamin D*
24 IU
48 IU
3%
Vitamin D
0.6µg
1.2µg
3%
Potassium
76mg
183mg
3%
Copper
0.03mg
0.051mg
2%
Vitamin B6
0.066mg
0.042mg
2%
Vitamin K
2.4µg
0.2µg
2%
Iron
0.14mg
0.1mg
1%
Manganese
0.027mg
0.014mg
1%
Vitamin B3
0.059mg
0.146mg
1%
Vitamin B5
0.41mg
0.368mg
1%
Protein per 100 calories
5.7g
3.4g
N/A
Calories per 10 g protein
177kcal
290kcal
N/A
Weight per 100 calories
25g
89g
N/A
Unsaturated / Saturated Fat ratio
0.57
0.52
N/A
Net carbs
3.09g
17.75g
N/A
Sugar
0.48g
17.75g
N/A
Vitamin B1
0.029mg
0.03mg
0%
Trans fat
0.917g
N/A
Choline
16.5mg
14.3mg
0%
Tryptophan
0.547mg
0.054mg
0%
Threonine
1.044mg
0.174mg
0%
Isoleucine
1.206mg
0.234mg
0%
Leucine
1.939mg
0.378mg
0%
Lysine
1.025mg
0.306mg
0%
Methionine
0.547mg
0.097mg
0%
Phenylalanine
1.074mg
0.186mg
0%
Valine
1.404mg
0.258mg
0%
Histidine
0.547mg
0.105mg
0%
Omega-3 - EPA
0.01g
0g
N/A
Omega-3 - DHA
0.001g
0g
N/A
Omega-3 - DPA
0.017g
0g
N/A
Omega-6 - Eicosadienoic acid
0.007g
N/A
Macronutrient Comparison
Macronutrient breakdown side-by-side comparison
3
23%
33%
3%
37%
4%
Protein:
22.87 g
Fats:
33.31 g
Carbs:
3.09 g
Water:
37.02 g
Other:
3.71 g
2
4%
3%
18%
74%
Protein:
3.86 g
Fats:
3.03 g
Carbs:
17.75 g
Water:
74.45 g
Other:
0.91 g
Contains
more
Protein Protein
+492.5%
Contains
more
Fats Fats
+999.3%
Contains
more
Other Other
+307.7%
Contains
more
Carbs Carbs
+474.4%
Contains
more
Water Water
+101.1%
Fat Type Comparison
Fat type breakdown side-by-side comparison
2
64%
31%
5%
Saturated fat:
Sat. Fat
18.867 g
Monounsaturated fat:
Mono. Fat
9.246 g
Polyunsaturated fat:
Poly. Fat
1.421 g
1
66%
30%
4%
Saturated fat:
Sat. Fat
1.886 g
Monounsaturated fat:
Mono. Fat
0.875 g
Polyunsaturated fat:
Poly. Fat
0.113 g
Contains
more
Mono. Fat Monounsaturated fat
+956.7%
Contains
more
Poly. Fat Polyunsaturated fat
+1157.5%
Contains
less
Sat. Fat Saturated fat
-90%