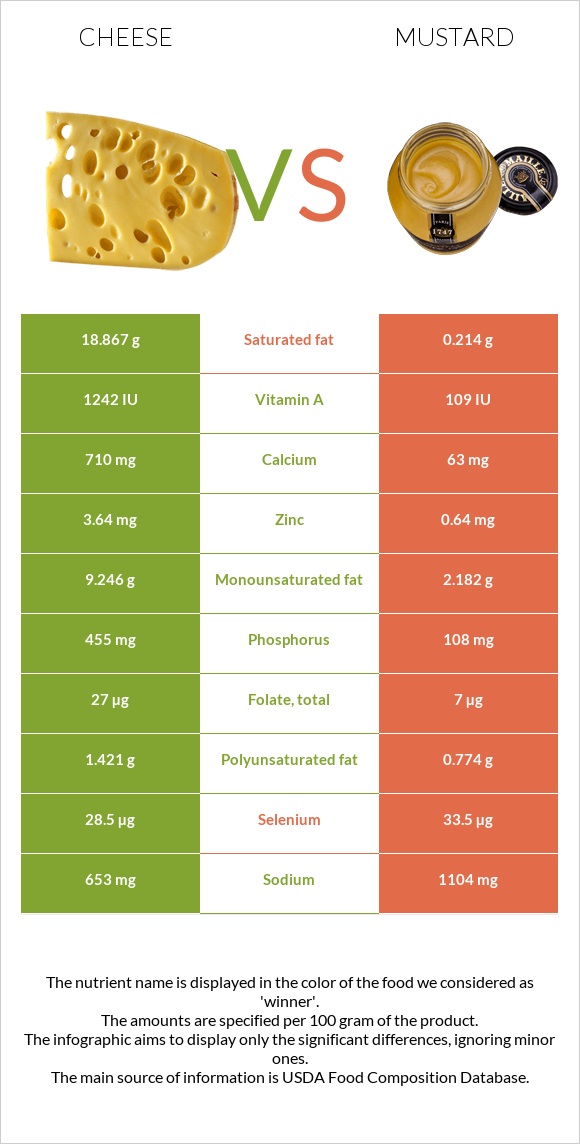
A recap on the differences between cheese and mustard Cheese is higher in calcium, phosphorus, vitamin B12, vitamin B2, zinc, and vitamin A, yet mustard is higher in iron. Cheese covers your daily saturated fat needs 93% more than mustard. The amount of cholesterol in mustard is lower. The glycemic index of cheese is lower. Food varieties used in this article are Cheese, cheddar and Mustard, prepared, yellow .
Infographic
Mineral Comparison
Mineral comparison score is based on the number of minerals by which one or the other food is richer. The "coverage" charts below show how much of the daily needs can be covered by 300 grams of the food.
4
100 g
300 g
1 cubic inch - 17g 1 slice (1 oz) - 28g 1 oz - 28.35g 1 cup, shredded - 113g 1 cup, diced - 132g 1 cup, melted - 244g
Magnesium
Magnesium
Calcium
Calcium
Potassium
Potassium
Iron
Iron
Copper
Copper
Zinc
Zinc
Phosphorus
Phosphorus
Sodium
Sodium
Manganese
Manganese
Selenium
Selenium
19%
213%
6.7%
5.3%
10%
99%
195%
85%
3.5%
155%
6
100 g
300 g
1 tsp or 1 packet - 5g 1 cup - 249g
Magnesium
Magnesium
Calcium
Calcium
Potassium
Potassium
Iron
Iron
Copper
Copper
Zinc
Zinc
Phosphorus
Phosphorus
Sodium
Sodium
Manganese
Manganese
Selenium
Selenium
34%
19%
13%
60%
25%
17%
46%
144%
55%
183%
Vitamin Comparison
Vitamin comparison score is based on the number of vitamins by which one or the other food is richer. The "coverage" charts below show how much of the daily needs can be covered by 300 grams of the food.
8
100 g
300 g
1 cubic inch - 17g 1 slice (1 oz) - 28g 1 oz - 28.35g 1 cup, shredded - 113g 1 cup, diced - 132g 1 cup, melted - 244g
Vitamin C
Vit. C
Vitamin D
Vit. D
Vitamin A
Vit. A
Vitamin E
Vit. E
Vitamin B1
Vit. B1
Vitamin B2
Vit. B2
Vitamin B3
Vit. B3
Vitamin B5
Vit. B5
Vitamin B6
Vit. B6
Vitamin B12
Vit. B12
Vitamin K
Vit. K
Folate
Folate
0%
9%
110%
14%
7.3%
99%
1.1%
25%
15%
138%
6%
20%
3
100 g
300 g
1 tsp or 1 packet - 5g 1 cup - 249g
Vitamin C
Vit. C
Vitamin D
Vit. D
Vitamin A
Vit. A
Vitamin E
Vit. E
Vitamin B1
Vit. B1
Vitamin B2
Vit. B2
Vitamin B3
Vit. B3
Vitamin B5
Vit. B5
Vitamin B6
Vit. B6
Vitamin B12
Vit. B12
Vitamin K
Vit. K
Folate
Folate
1%
0%
1.7%
7.2%
44%
16%
11%
15%
16%
0%
3.5%
5.3%
All nutrients comparison - raw data values
Nutrient
DV% diff.
Saturated fat
18.867g
0.214g
85%
Calcium
710mg
63mg
65%
Phosphorus
455mg
108mg
50%
Fats
33.31g
3.34g
46%
Vitamin B12
1.1µg
0µg
46%
Protein
22.87g
3.74g
38%
Vitamin A
330µg
5µg
36%
Cholesterol
99mg
0mg
33%
Vitamin B2
0.428mg
0.07mg
28%
Zinc
3.64mg
0.64mg
27%
Sodium
653mg
1104mg
20%
Iron
0.14mg
1.61mg
18%
Monounsaturated fat
9.246g
2.182g
18%
Calories
404kcal
60kcal
17%
Manganese
0.027mg
0.422mg
17%
Fiber
0g
4g
16%
Vitamin B1
0.029mg
0.177mg
12%
Selenium
28.5µg
33.5µg
9%
Magnesium
27mg
48mg
5%
Copper
0.03mg
0.074mg
5%
Folate
27µg
7µg
5%
Polyunsaturated fat
1.421g
0.774g
4%
Vitamin D*
24 IU
0 IU
3%
Vitamin D
0.6µg
0µg
3%
Vitamin B3
0.059mg
0.565mg
3%
Vitamin B5
0.41mg
0.254mg
3%
Potassium
76mg
152mg
2%
Vitamin E
0.71mg
0.36mg
2%
Carbs
3.09g
5.83g
1%
Vitamin K
2.4µg
1.4µg
1%
Choline
16.5mg
22.4mg
1%
Protein per 100 calories
5.7g
6.2g
N/A
Calories per 10 g protein
177kcal
160kcal
N/A
Weight per 100 calories
25g
167g
N/A
Unsaturated / Saturated Fat ratio
0.57
14
N/A
Vitamin C
0mg
0.3mg
0%
Net carbs
3.09g
1.83g
N/A
Sugar
0.48g
0.92g
N/A
Starch
0.64g
0%
Vitamin B6
0.066mg
0.07mg
0%
Trans fat
0.917g
0.009g
N/A
Tryptophan
0.547mg
0.009mg
0%
Threonine
1.044mg
0.167mg
0%
Isoleucine
1.206mg
0.146mg
0%
Leucine
1.939mg
0.292mg
0%
Lysine
1.025mg
0.264mg
0%
Methionine
0.547mg
0.076mg
0%
Phenylalanine
1.074mg
0.161mg
0%
Valine
1.404mg
0.189mg
0%
Histidine
0.547mg
0.119mg
0%
Fructose
0g
0.23g
0%
Omega-3 - EPA
0.01g
0g
N/A
Omega-3 - DHA
0.001g
0g
N/A
Omega-3 - ALA
0.373g
N/A
Omega-3 - DPA
0.017g
0g
N/A
Omega-3 - Eicosatrienoic acid
0.018g
N/A
Omega-6 - Eicosadienoic acid
0.007g
0.01g
N/A
Omega-6 - Linoleic acid
0.358g
N/A
Macronutrient Comparison
Macronutrient breakdown side-by-side comparison
3
23%
33%
3%
37%
4%
Protein:
22.87 g
Fats:
33.31 g
Carbs:
3.09 g
Water:
37.02 g
Other:
3.71 g
2
4%
3%
6%
84%
3%
Protein:
3.74 g
Fats:
3.34 g
Carbs:
5.83 g
Water:
83.72 g
Other:
3.37 g
Contains
more
Protein Protein
+511.5%
Contains
more
Fats Fats
+897.3%
Contains
more
Carbs Carbs
+88.7%
Contains
more
Water Water
+126.1%
Fat Type Comparison
Fat type breakdown side-by-side comparison
2
64%
31%
5%
Saturated fat:
Sat. Fat
18.867 g
Monounsaturated fat:
Mono. Fat
9.246 g
Polyunsaturated fat:
Poly. Fat
1.421 g
1
7%
69%
24%
Saturated fat:
Sat. Fat
0.214 g
Monounsaturated fat:
Mono. Fat
2.182 g
Polyunsaturated fat:
Poly. Fat
0.774 g
Contains
more
Mono. Fat Monounsaturated fat
+323.7%
Contains
more
Poly. Fat Polyunsaturated fat
+83.6%
Contains
less
Sat. Fat Saturated fat
-98.9%
Carbohydrate type comparison
Carbohydrate type breakdown side-by-side comparison
2
54%
25%
21%
Starch:
0 g
Sucrose:
0 g
Glucose:
0.26 g
Fructose:
0 g
Lactose:
0.12 g
Maltose:
0 g
Galactose:
0.1 g
4
41%
14%
30%
15%
Starch:
0.64 g
Sucrose:
0.21 g
Glucose:
0.47 g
Fructose:
0.23 g
Lactose:
0 g
Maltose:
0 g
Galactose:
0 g
Contains
more
Lactose Lactose
+∞%
Contains
more
Galactose Galactose
+∞%
Contains
more
Starch Starch
+∞%
Contains
more
Sucrose Sucrose
+∞%
Contains
more
Glucose Glucose
+80.8%
Contains
more
Fructose Fructose
+∞%