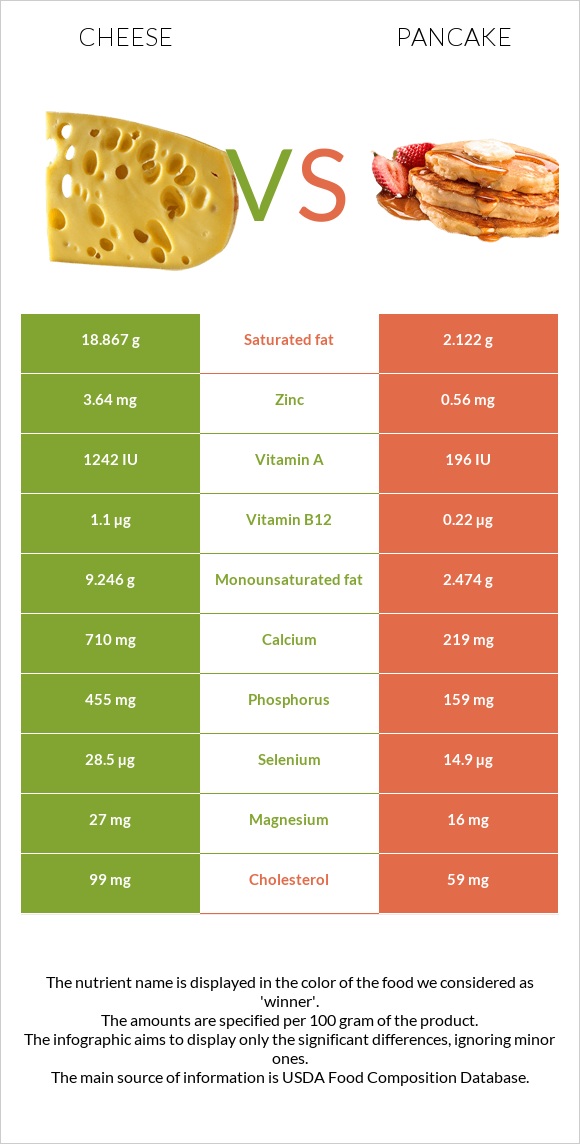
Important differences between cheese and pancake Cheese has more calcium, phosphorus, vitamin B12, zinc, selenium, and vitamin A; however, pancake has more iron and vitamin B1. Cheese's daily need coverage for saturated fat is 84% more. Cheese has 7 times more zinc than pancake. Cheese has 3.64mg of zinc, while pancake has 0.56mg. Pancake is lower in saturated fat. Pancake has a higher glycemic index than cheese. The food varieties used in the comparison are Cheese, cheddar and Pancakes, plain, prepared from recipe .
Infographic
Mineral Comparison
Mineral comparison score is based on the number of minerals by which one or the other food is richer. The "coverage" charts below show how much of the daily needs can be covered by 300 grams of the food.
5
100 g
300 g
1 cubic inch - 17g 1 slice (1 oz) - 28g 1 oz - 28.35g 1 cup, shredded - 113g 1 cup, diced - 132g 1 cup, melted - 244g
Magnesium
Magnesium
Calcium
Calcium
Potassium
Potassium
Iron
Iron
Copper
Copper
Zinc
Zinc
Phosphorus
Phosphorus
Sodium
Sodium
Manganese
Manganese
Selenium
Selenium
19%
213%
6.7%
5.3%
10%
99%
195%
85%
3.5%
155%
5
100 g
300 g
1 oz - 28.35g 1 pancake (4" dia) - 38g 1 pancake (6" dia) - 77g
Magnesium
Magnesium
Calcium
Calcium
Potassium
Potassium
Iron
Iron
Copper
Copper
Zinc
Zinc
Phosphorus
Phosphorus
Sodium
Sodium
Manganese
Manganese
Selenium
Selenium
11%
66%
12%
68%
16%
15%
68%
57%
26%
81%
Vitamin Comparison
Vitamin comparison score is based on the number of vitamins by which one or the other food is richer. The "coverage" charts below show how much of the daily needs can be covered by 300 grams of the food.
7
100 g
300 g
1 cubic inch - 17g 1 slice (1 oz) - 28g 1 oz - 28.35g 1 cup, shredded - 113g 1 cup, diced - 132g 1 cup, melted - 244g
Vitamin C
Vit. C
Vitamin D
Vit. D
Vitamin A
Vit. A
Vitamin E
Vit. E
Vitamin B1
Vit. B1
Vitamin B2
Vit. B2
Vitamin B3
Vit. B3
Vitamin B5
Vit. B5
Vitamin B6
Vit. B6
Vitamin B12
Vit. B12
Vitamin K
Vit. K
Folate
Folate
0%
9%
110%
14%
7.3%
99%
1.1%
25%
15%
138%
6%
20%
4
100 g
300 g
1 oz - 28.35g 1 pancake (4" dia) - 38g 1 pancake (6" dia) - 77g
Vitamin C
Vit. C
Vitamin D
Vit. D
Vitamin A
Vit. A
Vitamin E
Vit. E
Vitamin B1
Vit. B1
Vitamin B2
Vit. B2
Vitamin B3
Vit. B3
Vitamin B5
Vit. B5
Vitamin B6
Vit. B6
Vitamin B12
Vit. B12
Vitamin K
Vit. K
Folate
Folate
1%
0%
18%
0%
50%
65%
29%
24%
11%
28%
0%
29%
All nutrients comparison - raw data values
Nutrient
DV% diff.
Saturated fat
18.867g
2.122g
76%
Calcium
710mg
219mg
49%
Phosphorus
455mg
159mg
42%
Vitamin B12
1.1µg
0.22µg
37%
Fats
33.31g
9.7g
36%
Protein
22.87g
6.4g
33%
Vitamin A
330µg
54µg
31%
Zinc
3.64mg
0.56mg
28%
Selenium
28.5µg
14.9µg
25%
Iron
0.14mg
1.8mg
21%
Polyunsaturated fat
1.421g
4.447g
20%
Monounsaturated fat
9.246g
2.474g
17%
Vitamin B1
0.029mg
0.201mg
14%
Cholesterol
99mg
59mg
13%
Vitamin B2
0.428mg
0.281mg
11%
Calories
404kcal
227kcal
9%
Sodium
653mg
439mg
9%
Vitamin B3
0.059mg
1.567mg
9%
Carbs
3.09g
28.3g
8%
Manganese
0.027mg
0.2mg
8%
Vitamin E
0.71mg
5%
Vitamin D*
24 IU
3%
Vitamin D
0.6µg
3%
Magnesium
27mg
16mg
3%
Folate
27µg
38µg
3%
Choline
16.5mg
3%
Potassium
76mg
132mg
2%
Copper
0.03mg
0.049mg
2%
Vitamin B6
0.066mg
0.046mg
2%
Vitamin K
2.4µg
2%
Protein per 100 calories
5.7g
2.8g
N/A
Calories per 10 g protein
177kcal
355kcal
N/A
Weight per 100 calories
25g
44g
N/A
Unsaturated / Saturated Fat ratio
0.57
3.3
N/A
Vitamin C
0mg
0.3mg
0%
Net carbs
3.09g
28.3g
N/A
Sugar
0.48g
N/A
Vitamin B5
0.41mg
0.405mg
0%
Trans fat
0.917g
N/A
Tryptophan
0.547mg
0.08mg
0%
Threonine
1.044mg
0.237mg
0%
Isoleucine
1.206mg
0.297mg
0%
Leucine
1.939mg
0.513mg
0%
Lysine
1.025mg
0.321mg
0%
Methionine
0.547mg
0.147mg
0%
Phenylalanine
1.074mg
0.319mg
0%
Valine
1.404mg
0.335mg
0%
Histidine
0.547mg
0.152mg
0%
Omega-3 - EPA
0.01g
0g
N/A
Omega-3 - DHA
0.001g
0.005g
N/A
Omega-3 - DPA
0.017g
0g
N/A
Omega-6 - Eicosadienoic acid
0.007g
N/A
Macronutrient Comparison
Macronutrient breakdown side-by-side comparison
3
23%
33%
3%
37%
4%
Protein:
22.87 g
Fats:
33.31 g
Carbs:
3.09 g
Water:
37.02 g
Other:
3.71 g
2
6%
10%
28%
53%
3%
Protein:
6.4 g
Fats:
9.7 g
Carbs:
28.3 g
Water:
52.9 g
Other:
2.7 g
Contains
more
Protein Protein
+257.3%
Contains
more
Fats Fats
+243.4%
Contains
more
Other Other
+37.4%
Contains
more
Carbs Carbs
+815.9%
Contains
more
Water Water
+42.9%
Fat Type Comparison
Fat type breakdown side-by-side comparison
1
64%
31%
5%
Saturated fat:
Sat. Fat
18.867 g
Monounsaturated fat:
Mono. Fat
9.246 g
Polyunsaturated fat:
Poly. Fat
1.421 g
2
23%
27%
49%
Saturated fat:
Sat. Fat
2.122 g
Monounsaturated fat:
Mono. Fat
2.474 g
Polyunsaturated fat:
Poly. Fat
4.447 g
Contains
more
Mono. Fat Monounsaturated fat
+273.7%
Contains
less
Sat. Fat Saturated fat
-88.8%
Contains
more
Poly. Fat Polyunsaturated fat
+212.9%