What are the main differences between cheese and patty? Cheese is richer in calcium, phosphorus, selenium, vitamin A, and vitamin B2, while patty is higher in vitamin B12, vitamin B3, and iron. Cheese's daily need coverage for calcium is 70% higher. Patty is lower in sodium. We used Cheese, cheddar and USDA Commodity, beef, patties (100%), frozen, raw types in this comparison.
Infographic
Mineral Comparison
Mineral comparison score is based on the number of minerals by which one or the other food is richer. The "coverage" charts below show how much of the daily needs can be covered by 300 grams of the food.
5
100 g
300 g
1 cubic inch - 17g 1 slice (1 oz) - 28g 1 oz - 28.35g 1 cup, shredded - 113g 1 cup, diced - 132g 1 cup, melted - 244g
Magnesium
Magnesium
Calcium
Calcium
Potassium
Potassium
Iron
Iron
Copper
Copper
Zinc
Zinc
Phosphorus
Phosphorus
Sodium
Sodium
Manganese
Manganese
Selenium
Selenium
19%
213%
6.7%
5.3%
10%
99%
195%
85%
3.5%
155%
5
100 g
300 g
3 oz - 85g
Magnesium
Magnesium
Calcium
Calcium
Potassium
Potassium
Iron
Iron
Copper
Copper
Zinc
Zinc
Phosphorus
Phosphorus
Sodium
Sodium
Manganese
Manganese
Selenium
Selenium
13%
2.1%
24%
72%
24%
112%
62%
9.7%
2.2%
81%
Vitamin Comparison
Vitamin comparison score is based on the number of vitamins by which one or the other food is richer. The "coverage" charts below show how much of the daily needs can be covered by 300 grams of the food.
7
100 g
300 g
1 cubic inch - 17g 1 slice (1 oz) - 28g 1 oz - 28.35g 1 cup, shredded - 113g 1 cup, diced - 132g 1 cup, melted - 244g
Vitamin C
Vit. C
Vitamin D
Vit. D
Vitamin A
Vit. A
Vitamin E
Vit. E
Vitamin B1
Vit. B1
Vitamin B2
Vit. B2
Vitamin B3
Vit. B3
Vitamin B5
Vit. B5
Vitamin B6
Vit. B6
Vitamin B12
Vit. B12
Vitamin K
Vit. K
Folate
Folate
0%
9%
110%
14%
7.3%
99%
1.1%
25%
15%
138%
6%
20%
4
100 g
300 g
3 oz - 85g
Vitamin C
Vit. C
Vitamin D
Vit. D
Vitamin A
Vit. A
Vitamin E
Vit. E
Vitamin B1
Vit. B1
Vitamin B2
Vit. B2
Vitamin B3
Vit. B3
Vitamin B5
Vit. B5
Vitamin B6
Vit. B6
Vitamin B12
Vit. B12
Vitamin K
Vit. K
Folate
Folate
0%
0%
0%
0%
11%
37%
72%
19%
49%
256%
0%
4.5%
All nutrients comparison - raw data values
Nutrient
DV% diff.
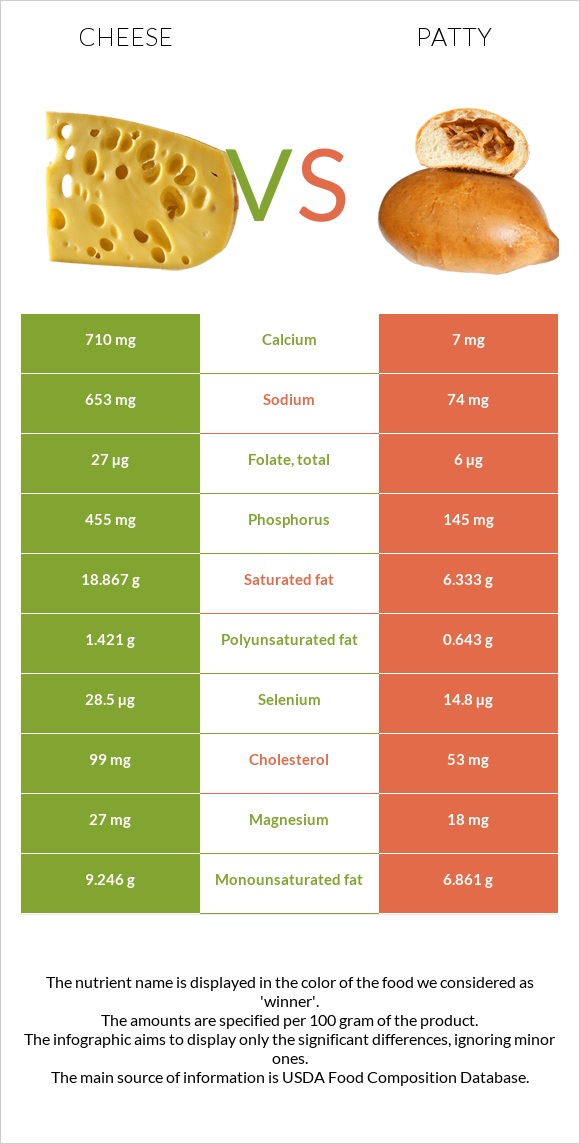
Calcium
710mg
7mg
70%
Saturated fat
18.867g
6.333g
57%
Phosphorus
455mg
145mg
44%
Vitamin B12
1.1µg
2.05µg
40%
Vitamin A
330µg
0µg
37%
Fats
33.31g
15.69g
27%
Sodium
653mg
74mg
25%
Selenium
28.5µg
14.8µg
25%
Vitamin B3
0.059mg
3.846mg
24%
Iron
0.14mg
1.93mg
22%
Vitamin B2
0.428mg
0.16mg
21%
Protein
22.87g
14.63g
16%
Cholesterol
99mg
53mg
15%
Vitamin B6
0.066mg
0.214mg
11%
Calories
404kcal
204kcal
10%
Potassium
76mg
269mg
6%
Monounsaturated fat
9.246g
6.861g
6%
Copper
0.03mg
0.073mg
5%
Vitamin E
0.71mg
5%
Folate
27µg
6µg
5%
Polyunsaturated fat
1.421g
0.643g
5%
Zinc
3.64mg
4.12mg
4%
Vitamin D*
24 IU
3%
Vitamin D
0.6µg
3%
Choline
16.5mg
3%
Magnesium
27mg
18mg
2%
Vitamin B5
0.41mg
0.309mg
2%
Vitamin K
2.4µg
2%
Carbs
3.09g
0g
1%
Vitamin B1
0.029mg
0.043mg
1%
Protein per 100 calories
5.7g
7.2g
N/A
Calories per 10 g protein
177kcal
139kcal
N/A
Weight per 100 calories
25g
49g
N/A
Unsaturated / Saturated Fat ratio
0.57
1.2
N/A
Net carbs
3.09g
0g
N/A
Sugar
0.48g
N/A
Manganese
0.027mg
0.017mg
0%
Trans fat
0.917g
N/A
Tryptophan
0.547mg
0%
Threonine
1.044mg
0%
Isoleucine
1.206mg
0%
Leucine
1.939mg
0%
Lysine
1.025mg
0%
Methionine
0.547mg
0%
Phenylalanine
1.074mg
0%
Valine
1.404mg
0%
Histidine
0.547mg
0%
Omega-3 - EPA
0.01g
0g
N/A
Omega-3 - DHA
0.001g
0g
N/A
Omega-3 - DPA
0.017g
0g
N/A
Omega-6 - Eicosadienoic acid
0.007g
N/A
Macronutrient Comparison
Macronutrient breakdown side-by-side comparison
3
23%
33%
3%
37%
4%
Protein:
22.87 g
Fats:
33.31 g
Carbs:
3.09 g
Water:
37.02 g
Other:
3.71 g
2
15%
16%
65%
5%
Protein:
14.63 g
Fats:
15.69 g
Carbs:
0 g
Water:
64.72 g
Other:
4.96 g
Contains
more
Protein Protein
+56.3%
Contains
more
Fats Fats
+112.3%
Contains
more
Carbs Carbs
+∞%
Contains
more
Water Water
+74.8%
Contains
more
Other Other
+33.7%
Fat Type Comparison
Fat type breakdown side-by-side comparison
2
64%
31%
5%
Saturated fat:
Sat. Fat
18.867 g
Monounsaturated fat:
Mono. Fat
9.246 g
Polyunsaturated fat:
Poly. Fat
1.421 g
1
46%
50%
5%
Saturated fat:
Sat. Fat
6.333 g
Monounsaturated fat:
Mono. Fat
6.861 g
Polyunsaturated fat:
Poly. Fat
0.643 g
Contains
more
Mono. Fat Monounsaturated fat
+34.8%
Contains
more
Poly. Fat Polyunsaturated fat
+121%
Contains
less
Sat. Fat Saturated fat
-66.4%