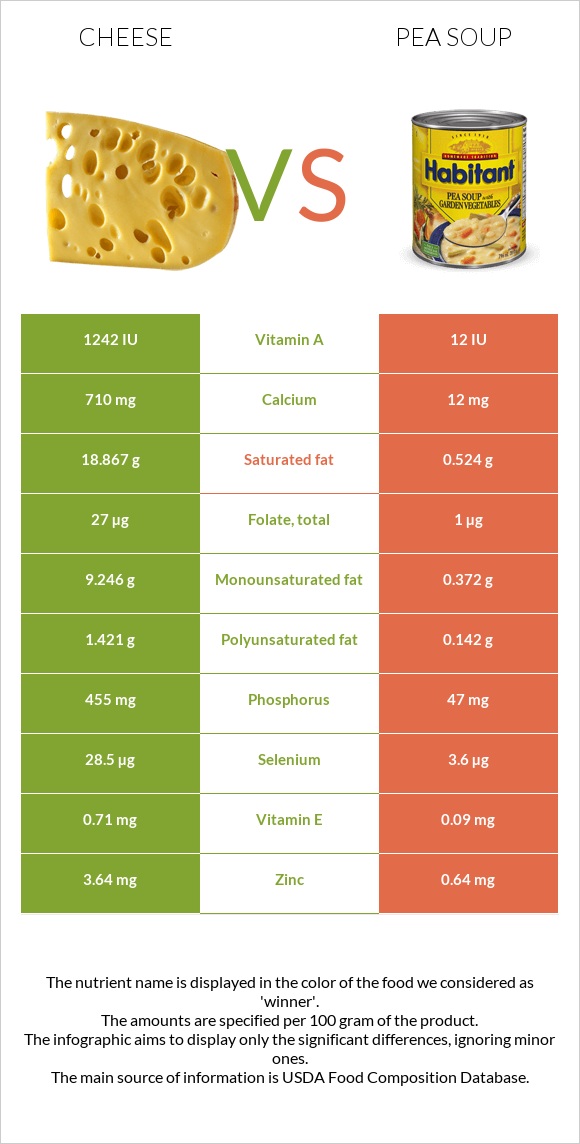
How are cheese and pea soup different? Pea soup contains less calcium, phosphorus, vitamin B12, selenium, vitamin B2, zinc, and vitamin A than cheese. Cheese covers your daily need for saturated fat, 92% more than pea soup. Pea soup contains less cholesterol. Pea soup has a higher glycemic index. The glycemic index of pea soup is 66, while the glycemic index of cheese is 0. Cheese, cheddar and Soup, pea, green, canned, prepared with equal volume water types were used in this article.
Infographic
Mineral Comparison
Mineral comparison score is based on the number of minerals by which one or the other food is richer. The "coverage" charts below show how much of the daily needs can be covered by 300 grams of the food.
5
100 g
300 g
1 cubic inch - 17g 1 slice (1 oz) - 28g 1 oz - 28.35g 1 cup, shredded - 113g 1 cup, diced - 132g 1 cup, melted - 244g
Magnesium
Magnesium
Calcium
Calcium
Potassium
Potassium
Iron
Iron
Copper
Copper
Zinc
Zinc
Phosphorus
Phosphorus
Sodium
Sodium
Manganese
Manganese
Selenium
Selenium
19%
213%
6.7%
5.3%
10%
99%
195%
85%
3.5%
155%
4
100 g
300 g
1 fl oz - 32.4g 1 serving 1 cup - 259g
Magnesium
Magnesium
Calcium
Calcium
Potassium
Potassium
Iron
Iron
Copper
Copper
Zinc
Zinc
Phosphorus
Phosphorus
Sodium
Sodium
Manganese
Manganese
Selenium
Selenium
11%
3.6%
6.3%
27%
49%
17%
20%
44%
32%
20%
Vitamin Comparison
Vitamin comparison score is based on the number of vitamins by which one or the other food is richer. The "coverage" charts below show how much of the daily needs can be covered by 300 grams of the food.
9
100 g
300 g
1 cubic inch - 17g 1 slice (1 oz) - 28g 1 oz - 28.35g 1 cup, shredded - 113g 1 cup, diced - 132g 1 cup, melted - 244g
Vitamin C
Vit. C
Vitamin D
Vit. D
Vitamin A
Vit. A
Vitamin E
Vit. E
Vitamin B1
Vit. B1
Vitamin B2
Vit. B2
Vitamin B3
Vit. B3
Vitamin B5
Vit. B5
Vitamin B6
Vit. B6
Vitamin B12
Vit. B12
Vitamin K
Vit. K
Folate
Folate
0%
9%
110%
14%
7.3%
99%
1.1%
25%
15%
138%
6%
20%
3
100 g
300 g
1 fl oz - 32.4g 1 serving 1 cup - 259g
Vitamin C
Vit. C
Vitamin D
Vit. D
Vitamin A
Vit. A
Vitamin E
Vit. E
Vitamin B1
Vit. B1
Vitamin B2
Vit. B2
Vitamin B3
Vit. B3
Vitamin B5
Vit. B5
Vitamin B6
Vit. B6
Vitamin B12
Vit. B12
Vitamin K
Vit. K
Folate
Folate
2%
0%
1%
1.8%
10%
5.8%
8.7%
2.9%
4.6%
0%
0.5%
0.75%
All nutrients comparison - raw data values
Nutrient
DV% diff.
Saturated fat
18.867g
0.524g
83%
Calcium
710mg
12mg
70%
Phosphorus
455mg
47mg
58%
Fats
33.31g
1.09g
50%
Vitamin B12
1.1µg
0µg
46%
Selenium
28.5µg
3.6µg
45%
Protein
22.87g
3.2g
39%
Vitamin A
330µg
3µg
36%
Cholesterol
99mg
0mg
33%
Vitamin B2
0.428mg
0.025mg
31%
Zinc
3.64mg
0.64mg
27%
Monounsaturated fat
9.246g
0.372g
22%
Calories
404kcal
61kcal
17%
Sodium
653mg
336mg
14%
Copper
0.03mg
0.146mg
13%
Manganese
0.027mg
0.245mg
9%
Polyunsaturated fat
1.421g
0.142g
9%
Fiber
0g
1.9g
8%
Iron
0.14mg
0.73mg
7%
Vitamin B5
0.41mg
0.049mg
7%
Folate
27µg
1µg
7%
Vitamin E
0.71mg
0.09mg
4%
Vitamin B6
0.066mg
0.02mg
4%
Vitamin D*
24 IU
0 IU
3%
Vitamin D
0.6µg
0µg
3%
Magnesium
27mg
15mg
3%
Vitamin B3
0.059mg
0.462mg
3%
Carbs
3.09g
9.88g
2%
Vitamin K
2.4µg
0.2µg
2%
Vitamin C
0mg
0.6mg
1%
Vitamin B1
0.029mg
0.04mg
1%
Choline
16.5mg
13.2mg
1%
Protein per 100 calories
5.7g
5.2g
N/A
Calories per 10 g protein
177kcal
191kcal
N/A
Weight per 100 calories
25g
164g
N/A
Unsaturated / Saturated Fat ratio
0.57
0.98
N/A
Net carbs
3.09g
7.98g
N/A
Potassium
76mg
71mg
0%
Sugar
0.48g
3.19g
N/A
Trans fat
0.917g
N/A
Tryptophan
0.547mg
0%
Threonine
1.044mg
0%
Isoleucine
1.206mg
0%
Leucine
1.939mg
0%
Lysine
1.025mg
0%
Methionine
0.547mg
0%
Phenylalanine
1.074mg
0%
Valine
1.404mg
0%
Histidine
0.547mg
0%
Omega-3 - EPA
0.01g
0g
N/A
Omega-3 - DHA
0.001g
0g
N/A
Omega-3 - DPA
0.017g
0g
N/A
Omega-6 - Eicosadienoic acid
0.007g
N/A
Macronutrient Comparison
Macronutrient breakdown side-by-side comparison
3
23%
33%
3%
37%
4%
Protein:
22.87 g
Fats:
33.31 g
Carbs:
3.09 g
Water:
37.02 g
Other:
3.71 g
2
3%
10%
85%
Protein:
3.2 g
Fats:
1.09 g
Carbs:
9.88 g
Water:
84.55 g
Other:
1.28 g
Contains
more
Protein Protein
+614.7%
Contains
more
Fats Fats
+2956%
Contains
more
Other Other
+189.8%
Contains
more
Carbs Carbs
+219.7%
Contains
more
Water Water
+128.4%
Fat Type Comparison
Fat type breakdown side-by-side comparison
2
64%
31%
5%
Saturated fat:
Sat. Fat
18.867 g
Monounsaturated fat:
Mono. Fat
9.246 g
Polyunsaturated fat:
Poly. Fat
1.421 g
1
50%
36%
14%
Saturated fat:
Sat. Fat
0.524 g
Monounsaturated fat:
Mono. Fat
0.372 g
Polyunsaturated fat:
Poly. Fat
0.142 g
Contains
more
Mono. Fat Monounsaturated fat
+2385.5%
Contains
more
Poly. Fat Polyunsaturated fat
+900.7%
Contains
less
Sat. Fat Saturated fat
-97.2%