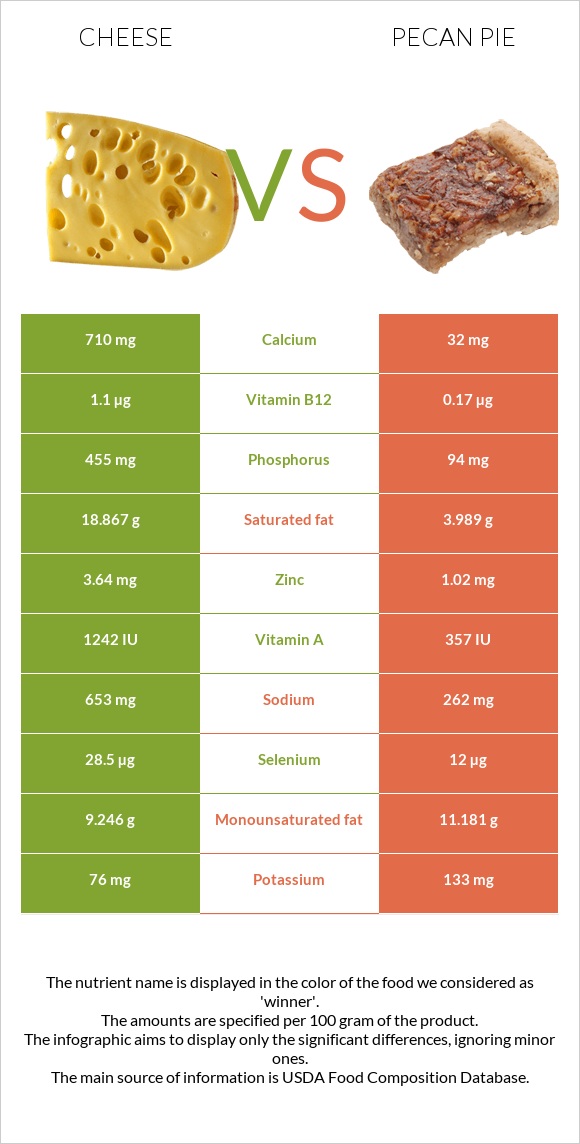
The main differences between cheese and pecan pie Cheese is richer in calcium, phosphorus, vitamin B12, selenium, zinc, vitamin B2, and vitamin A, yet pecan pie is richer in manganese and copper. Daily need coverage for saturated fat for cheese is 74% higher. Cheese contains 22 times more calcium than pecan pie. Cheese contains 710mg of calcium, while pecan pie contains 32mg. Pecan pie contains less saturated fat. Cheese has a lower glycemic index than pecan pie. Food types used in this article are Cheese, cheddar and Pie, pecan, prepared from recipe .
Infographic
Mineral Comparison
Mineral comparison score is based on the number of minerals by which one or the other food is richer. The "coverage" charts below show how much of the daily needs can be covered by 300 grams of the food.
4
100 g
300 g
1 cubic inch - 17g 1 slice (1 oz) - 28g 1 oz - 28.35g 1 cup, shredded - 113g 1 cup, diced - 132g 1 cup, melted - 244g
Magnesium
Magnesium
Calcium
Calcium
Potassium
Potassium
Iron
Iron
Copper
Copper
Zinc
Zinc
Phosphorus
Phosphorus
Sodium
Sodium
Manganese
Manganese
Selenium
Selenium
19%
213%
6.7%
5.3%
10%
99%
195%
85%
3.5%
155%
5
100 g
300 g
1 oz - 28.35g 1 piece (1/8 of 9" dia) - 122g
Magnesium
Magnesium
Calcium
Calcium
Potassium
Potassium
Iron
Iron
Copper
Copper
Zinc
Zinc
Phosphorus
Phosphorus
Sodium
Sodium
Manganese
Manganese
Selenium
Selenium
19%
9.6%
12%
56%
70%
28%
40%
34%
93%
65%
Vitamin Comparison
Vitamin comparison score is based on the number of vitamins by which one or the other food is richer. The "coverage" charts below show how much of the daily needs can be covered by 300 grams of the food.
6
100 g
300 g
1 cubic inch - 17g 1 slice (1 oz) - 28g 1 oz - 28.35g 1 cup, shredded - 113g 1 cup, diced - 132g 1 cup, melted - 244g
Vitamin C
Vit. C
Vitamin D
Vit. D
Vitamin A
Vit. A
Vitamin E
Vit. E
Vitamin B1
Vit. B1
Vitamin B2
Vit. B2
Vitamin B3
Vit. B3
Vitamin B5
Vit. B5
Vitamin B6
Vit. B6
Vitamin B12
Vit. B12
Vitamin K
Vit. K
Folate
Folate
0%
9%
110%
14%
7.3%
99%
1.1%
25%
15%
138%
6%
20%
4
100 g
300 g
1 oz - 28.35g 1 piece (1/8 of 9" dia) - 122g
Vitamin C
Vit. C
Vitamin D
Vit. D
Vitamin A
Vit. A
Vitamin E
Vit. E
Vitamin B1
Vit. B1
Vitamin B2
Vit. B2
Vitamin B3
Vit. B3
Vitamin B5
Vit. B5
Vitamin B6
Vit. B6
Vitamin B12
Vit. B12
Vitamin K
Vit. K
Folate
Folate
0.67%
0%
27%
0%
47%
42%
16%
29%
14%
21%
0%
20%
All nutrients comparison - raw data values
Nutrient
DV% diff.
Calcium
710mg
32mg
68%
Saturated fat
18.867g
3.989g
68%
Phosphorus
455mg
94mg
52%
Vitamin B12
1.1µg
0.17µg
39%
Protein
22.87g
4.9g
36%
Manganese
0.027mg
0.712mg
30%
Selenium
28.5µg
12µg
30%
Polyunsaturated fat
1.421g
5.71g
29%
Vitamin A
330µg
82µg
28%
Zinc
3.64mg
1.02mg
24%
Copper
0.03mg
0.211mg
20%
Vitamin B2
0.428mg
0.18mg
19%
Fats
33.31g
22.2g
17%
Iron
0.14mg
1.48mg
17%
Sodium
653mg
262mg
17%
Carbs
3.09g
52.2g
16%
Vitamin B1
0.029mg
0.188mg
13%
Vitamin E
0.71mg
5%
Vitamin B3
0.059mg
0.847mg
5%
Monounsaturated fat
9.246g
11.181g
5%
Cholesterol
99mg
87mg
4%
Vitamin D*
24 IU
3%
Vitamin D
0.6µg
3%
Choline
16.5mg
3%
Potassium
76mg
133mg
2%
Vitamin K
2.4µg
2%
Vitamin B5
0.41mg
0.479mg
1%
Calories
404kcal
412kcal
0%
Protein per 100 calories
5.7g
1.2g
N/A
Calories per 10 g protein
177kcal
841kcal
N/A
Weight per 100 calories
25g
24g
N/A
Unsaturated / Saturated Fat ratio
0.57
4.2
N/A
Vitamin C
0mg
0.2mg
0%
Net carbs
3.09g
52.2g
N/A
Magnesium
27mg
26mg
0%
Sugar
0.48g
N/A
Vitamin B6
0.066mg
0.06mg
0%
Folate
27µg
26µg
0%
Trans fat
0.917g
N/A
Tryptophan
0.547mg
0.069mg
0%
Threonine
1.044mg
0.189mg
0%
Isoleucine
1.206mg
0.223mg
0%
Leucine
1.939mg
0.372mg
0%
Lysine
1.025mg
0.248mg
0%
Methionine
0.547mg
0.125mg
0%
Phenylalanine
1.074mg
0.25mg
0%
Valine
1.404mg
0.255mg
0%
Histidine
0.547mg
0.116mg
0%
Omega-3 - EPA
0.01g
0.001g
N/A
Omega-3 - DHA
0.001g
0.008g
N/A
Omega-3 - DPA
0.017g
0g
N/A
Omega-6 - Eicosadienoic acid
0.007g
N/A
Macronutrient Comparison
Macronutrient breakdown side-by-side comparison
4
23%
33%
3%
37%
4%
Protein:
22.87 g
Fats:
33.31 g
Carbs:
3.09 g
Water:
37.02 g
Other:
3.71 g
1
5%
22%
52%
20%
Protein:
4.9 g
Fats:
22.2 g
Carbs:
52.2 g
Water:
19.5 g
Other:
1.2 g
Contains
more
Protein Protein
+366.7%
Contains
more
Fats Fats
+50%
Contains
more
Water Water
+89.8%
Contains
more
Other Other
+209.2%
Contains
more
Carbs Carbs
+1589.3%
Fat Type Comparison
Fat type breakdown side-by-side comparison
0
64%
31%
5%
Saturated fat:
Sat. Fat
18.867 g
Monounsaturated fat:
Mono. Fat
9.246 g
Polyunsaturated fat:
Poly. Fat
1.421 g
3
19%
54%
27%
Saturated fat:
Sat. Fat
3.989 g
Monounsaturated fat:
Mono. Fat
11.181 g
Polyunsaturated fat:
Poly. Fat
5.71 g
Contains
less
Sat. Fat Saturated fat
-78.9%
Contains
more
Mono. Fat Monounsaturated fat
+20.9%
Contains
more
Poly. Fat Polyunsaturated fat
+301.8%