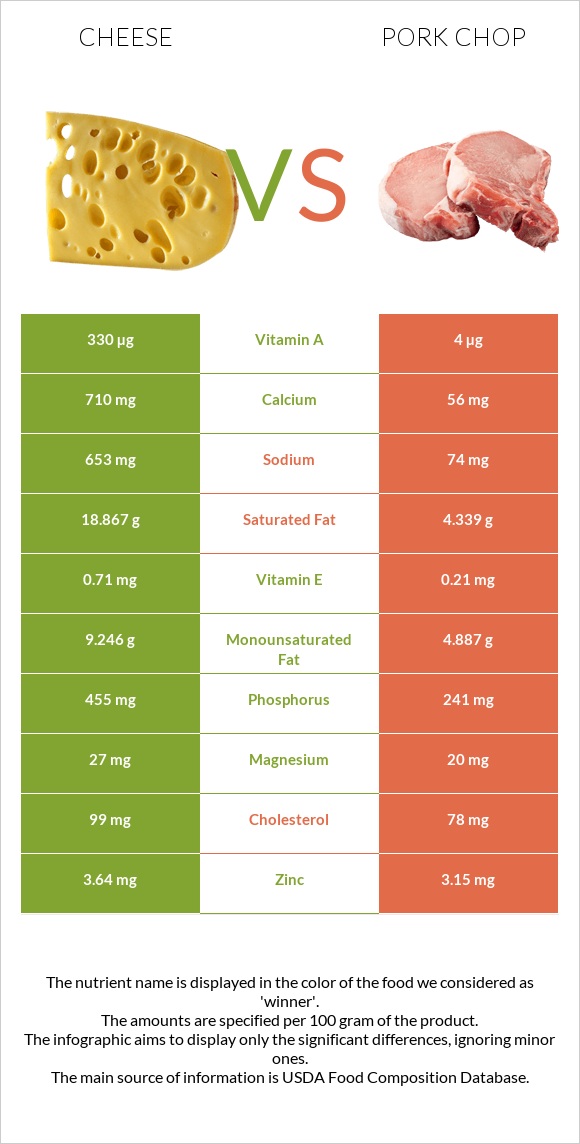
How are cheese and pork chop different? Cheese is higher in calcium, phosphorus, vitamin A, and vitamin B12; however, pork chop is richer in vitamin B3, vitamin B1, vitamin B6, and selenium. Daily need coverage for saturated fat for cheese is 73% higher. Cheese contains 83 times more vitamin A than pork chop. While cheese contains 1242 IU of vitamin A, pork chop contains only 15 IU. Pork chop has less sodium. Cheese, cheddar and Pork, fresh, loin, blade (chops), bone-in, separable lean, and fat, cooked, broiled are the varieties used in this article.
Infographic
Mineral Comparison
Mineral comparison score is based on the number of minerals by which one or the other food is richer. The "coverage" charts below show how much of the daily needs can be covered by 300 grams of the food.
5
100 g
300 g
1 cubic inch - 17g 1 slice (1 oz) - 28g 1 oz - 28.35g 1 cup, shredded - 113g 1 cup, diced - 132g 1 cup, melted - 244g
Magnesium
Magnesium
Calcium
Calcium
Potassium
Potassium
Iron
Iron
Copper
Copper
Zinc
Zinc
Phosphorus
Phosphorus
Sodium
Sodium
Manganese
Manganese
Selenium
Selenium
19%
213%
6.7%
5.3%
10%
99%
195%
85%
3.5%
155%
5
100 g
300 g
3 oz - 85g 1 chop - 219g
Magnesium
Magnesium
Calcium
Calcium
Potassium
Potassium
Iron
Iron
Copper
Copper
Zinc
Zinc
Phosphorus
Phosphorus
Sodium
Sodium
Manganese
Manganese
Selenium
Selenium
14%
17%
28%
33%
35%
86%
103%
9.7%
1.3%
199%
Vitamin Comparison
Vitamin comparison score is based on the number of vitamins by which one or the other food is richer. The "coverage" charts below show how much of the daily needs can be covered by 300 grams of the food.
6
100 g
300 g
1 cubic inch - 17g 1 slice (1 oz) - 28g 1 oz - 28.35g 1 cup, shredded - 113g 1 cup, diced - 132g 1 cup, melted - 244g
Vitamin C
Vit. C
Vitamin D
Vit. D
Vitamin A
Vit. A
Vitamin E
Vit. E
Vitamin B1
Vit. B1
Vitamin B2
Vit. B2
Vitamin B3
Vit. B3
Vitamin B5
Vit. B5
Vitamin B6
Vit. B6
Vitamin B12
Vit. B12
Vitamin K
Vit. K
Folate
Folate
0%
9%
110%
14%
7.3%
99%
1.1%
25%
15%
138%
6%
20%
5
100 g
300 g
3 oz - 85g 1 chop - 219g
Vitamin C
Vit. C
Vitamin D
Vit. D
Vitamin A
Vit. A
Vitamin E
Vit. E
Vitamin B1
Vit. B1
Vitamin B2
Vit. B2
Vitamin B3
Vit. B3
Vitamin B5
Vit. B5
Vitamin B6
Vit. B6
Vitamin B12
Vit. B12
Vitamin K
Vit. K
Folate
Folate
0%
15%
1.3%
4.2%
123%
72%
149%
66%
113%
83%
0%
0%
All nutrients comparison - raw data values
Nutrient
DV% diff.
Saturated fat
18.867g
4.339g
66%
Calcium
710mg
56mg
65%
Vitamin B3
0.059mg
7.927mg
49%
Vitamin B1
0.029mg
0.49mg
38%
Vitamin A
330µg
4µg
36%
Vitamin B6
0.066mg
0.489mg
33%
Phosphorus
455mg
241mg
31%
Fats
33.31g
14.35g
29%
Sodium
653mg
74mg
25%
Vitamin B12
1.1µg
0.66µg
18%
Selenium
28.5µg
36.4µg
14%
Vitamin B5
0.41mg
1.104mg
14%
Monounsaturated fat
9.246g
4.887g
11%
Calories
404kcal
231kcal
9%
Iron
0.14mg
0.87mg
9%
Vitamin B2
0.428mg
0.313mg
9%
Choline
16.5mg
67.5mg
9%
Copper
0.03mg
0.105mg
8%
Cholesterol
99mg
78mg
7%
Potassium
76mg
315mg
7%
Folate
27µg
0µg
7%
Zinc
3.64mg
3.15mg
4%
Vitamin E
0.71mg
0.21mg
3%
Polyunsaturated fat
1.421g
1.894g
3%
Protein
22.87g
23.72g
2%
Vitamin D*
24 IU
40 IU
2%
Vitamin D
0.6µg
1µg
2%
Magnesium
27mg
20mg
2%
Vitamin K
2.4µg
0µg
2%
Carbs
3.09g
0g
1%
Manganese
0.027mg
0.01mg
1%
Protein per 100 calories
5.7g
10g
N/A
Calories per 10 g protein
177kcal
97kcal
N/A
Weight per 100 calories
25g
43g
N/A
Unsaturated / Saturated Fat ratio
0.57
1.6
N/A
Net carbs
3.09g
0g
N/A
Sugar
0.48g
0g
N/A
Trans fat
0.917g
0.066g
N/A
Tryptophan
0.547mg
0.282mg
0%
Threonine
1.044mg
1.043mg
0%
Isoleucine
1.206mg
1.123mg
0%
Leucine
1.939mg
1.952mg
0%
Lysine
1.025mg
2.109mg
0%
Methionine
0.547mg
0.65mg
0%
Phenylalanine
1.074mg
0.985mg
0%
Valine
1.404mg
1.2mg
0%
Histidine
0.547mg
0.965mg
0%
Omega-3 - EPA
0.01g
0g
N/A
Omega-3 - DHA
0.001g
0.001g
N/A
Omega-3 - ALA
0.065g
N/A
Omega-3 - DPA
0.017g
0.011g
N/A
Omega-6 - Gamma-linoleic acid
0.003g
N/A
Omega-6 - Eicosadienoic acid
0.007g
0.065g
N/A
Omega-6 - Linoleic acid
0.922g
N/A
Macronutrient Comparison
Macronutrient breakdown side-by-side comparison
3
23%
33%
3%
37%
4%
Protein:
22.87 g
Fats:
33.31 g
Carbs:
3.09 g
Water:
37.02 g
Other:
3.71 g
2
24%
14%
61%
Protein:
23.72 g
Fats:
14.35 g
Carbs:
0 g
Water:
61.45 g
Other:
0.48 g
Contains
more
Fats Fats
+132.1%
Contains
more
Carbs Carbs
+∞%
Contains
more
Other Other
+672.9%
Contains
more
Water Water
+66%
~equal in
Protein
~23.72g
Fat Type Comparison
Fat type breakdown side-by-side comparison
1
64%
31%
5%
Saturated fat:
Sat. Fat
18.867 g
Monounsaturated fat:
Mono. Fat
9.246 g
Polyunsaturated fat:
Poly. Fat
1.421 g
2
39%
44%
17%
Saturated fat:
Sat. Fat
4.339 g
Monounsaturated fat:
Mono. Fat
4.887 g
Polyunsaturated fat:
Poly. Fat
1.894 g
Contains
more
Mono. Fat Monounsaturated fat
+89.2%
Contains
less
Sat. Fat Saturated fat
-77%
Contains
more
Poly. Fat Polyunsaturated fat
+33.3%