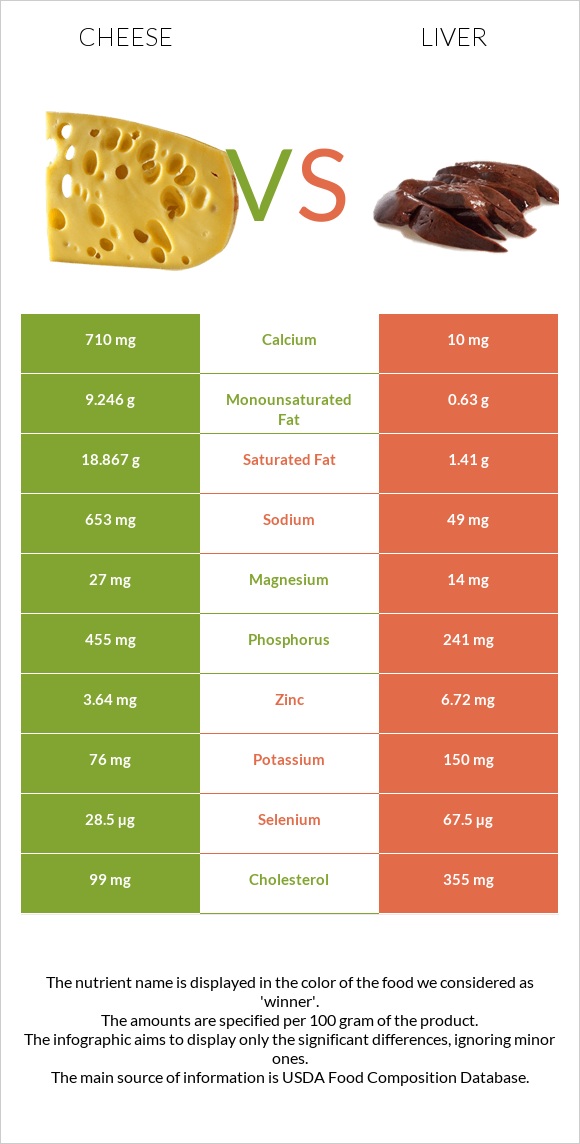
Significant differences between cheese and liver Cheese has more calcium; however, liver is richer in vitamin B12, vitamin A, iron, vitamin B2, vitamin B5, selenium, and copper. Liver covers your daily vitamin B12 needs 732% more than cheese. Liver has 71 times less calcium than cheese. Cheese has 710mg of calcium, while liver has 10mg. Liver contains less saturated fat. Specific food types used in this comparison are Cheese, cheddar and Pork, fresh, variety meats, and by-products, liver, cooked, braised .
Infographic
Mineral Comparison
Mineral comparison score is based on the number of minerals by which one or the other food is richer. The "coverage" charts below show how much of the daily needs can be covered by 300 grams of the food.
3
100 g
300 g
1 cubic inch - 17g 1 slice (1 oz) - 28g 1 oz - 28.35g 1 cup, shredded - 113g 1 cup, diced - 132g 1 cup, melted - 244g
Magnesium
Magnesium
Calcium
Calcium
Potassium
Potassium
Iron
Iron
Copper
Copper
Zinc
Zinc
Phosphorus
Phosphorus
Sodium
Sodium
Manganese
Manganese
Selenium
Selenium
19%
213%
6.7%
5.3%
10%
99%
195%
85%
3.5%
155%
7
100 g
300 g
3 oz - 85g
Magnesium
Magnesium
Calcium
Calcium
Potassium
Potassium
Iron
Iron
Copper
Copper
Zinc
Zinc
Phosphorus
Phosphorus
Sodium
Sodium
Manganese
Manganese
Selenium
Selenium
10%
3%
13%
672%
211%
183%
103%
6.4%
39%
368%
Vitamin Comparison
Vitamin comparison score is based on the number of vitamins by which one or the other food is richer. The "coverage" charts below show how much of the daily needs can be covered by 300 grams of the food.
3
100 g
300 g
1 cubic inch - 17g 1 slice (1 oz) - 28g 1 oz - 28.35g 1 cup, shredded - 113g 1 cup, diced - 132g 1 cup, melted - 244g
Vitamin C
Vit. C
Vitamin D
Vit. D
Vitamin A
Vit. A
Vitamin E
Vit. E
Vitamin B1
Vit. B1
Vitamin B2
Vit. B2
Vitamin B3
Vit. B3
Vitamin B5
Vit. B5
Vitamin B6
Vit. B6
Vitamin B12
Vit. B12
Vitamin K
Vit. K
Folate
Folate
0%
9%
110%
14%
7.3%
99%
1.1%
25%
15%
138%
6%
20%
9
100 g
300 g
3 oz - 85g
Vitamin C
Vit. C
Vitamin D
Vit. D
Vitamin A
Vit. A
Vitamin E
Vit. E
Vitamin B1
Vit. B1
Vitamin B2
Vit. B2
Vitamin B3
Vit. B3
Vitamin B5
Vit. B5
Vitamin B6
Vit. B6
Vitamin B12
Vit. B12
Vitamin K
Vit. K
Folate
Folate
79%
0%
1802%
0%
65%
507%
158%
286%
132%
2334%
0%
122%
All nutrients comparison - raw data values
Nutrient
DV% diff.
Vitamin B12
1.1µg
18.67µg
732%
Vitamin A
330µg
5405µg
564%
Iron
0.14mg
17.92mg
222%
Vitamin B2
0.428mg
2.196mg
136%
Vitamin B5
0.41mg
4.774mg
87%
Cholesterol
99mg
355mg
85%
Saturated fat
18.867g
1.41g
79%
Selenium
28.5µg
67.5µg
71%
Calcium
710mg
10mg
70%
Copper
0.03mg
0.634mg
67%
Vitamin B3
0.059mg
8.435mg
52%
Fats
33.31g
4.4g
44%
Vitamin B6
0.066mg
0.57mg
39%
Folate
27µg
163µg
34%
Phosphorus
455mg
241mg
31%
Zinc
3.64mg
6.72mg
28%
Vitamin C
0mg
23.6mg
26%
Sodium
653mg
49mg
26%
Monounsaturated fat
9.246g
0.63g
22%
Vitamin B1
0.029mg
0.258mg
19%
Calories
404kcal
165kcal
12%
Manganese
0.027mg
0.3mg
12%
Protein
22.87g
26.02g
6%
Vitamin E
0.71mg
5%
Vitamin D*
24 IU
3%
Vitamin D
0.6µg
3%
Magnesium
27mg
14mg
3%
Choline
16.5mg
3%
Potassium
76mg
150mg
2%
Vitamin K
2.4µg
2%
Polyunsaturated fat
1.421g
1.05g
2%
Protein per 100 calories
5.7g
16g
N/A
Calories per 10 g protein
177kcal
63kcal
N/A
Weight per 100 calories
25g
61g
N/A
Unsaturated / Saturated Fat ratio
0.57
1.2
N/A
Net carbs
3.09g
3.76g
N/A
Carbs
3.09g
3.76g
0%
Sugar
0.48g
N/A
Trans fat
0.917g
N/A
Tryptophan
0.547mg
0.366mg
0%
Threonine
1.044mg
1.107mg
0%
Isoleucine
1.206mg
1.32mg
0%
Leucine
1.939mg
2.319mg
0%
Lysine
1.025mg
2.007mg
0%
Methionine
0.547mg
0.645mg
0%
Phenylalanine
1.074mg
1.274mg
0%
Valine
1.404mg
1.607mg
0%
Histidine
0.547mg
0.708mg
0%
Omega-3 - EPA
0.01g
0g
N/A
Omega-3 - DHA
0.001g
0.03g
N/A
Omega-3 - DPA
0.017g
0.04g
N/A
Omega-6 - Eicosadienoic acid
0.007g
N/A
Macronutrient Comparison
Macronutrient breakdown side-by-side comparison
2
23%
33%
3%
37%
4%
Protein:
22.87 g
Fats:
33.31 g
Carbs:
3.09 g
Water:
37.02 g
Other:
3.71 g
3
26%
4%
4%
64%
Protein:
26.02 g
Fats:
4.4 g
Carbs:
3.76 g
Water:
64.32 g
Other:
1.5 g
Contains
more
Fats Fats
+657%
Contains
more
Other Other
+147.3%
Contains
more
Protein Protein
+13.8%
Contains
more
Carbs Carbs
+21.7%
Contains
more
Water Water
+73.7%
Fat Type Comparison
Fat type breakdown side-by-side comparison
2
64%
31%
5%
Saturated fat:
Sat. Fat
18.867 g
Monounsaturated fat:
Mono. Fat
9.246 g
Polyunsaturated fat:
Poly. Fat
1.421 g
1
46%
20%
34%
Saturated fat:
Sat. Fat
1.41 g
Monounsaturated fat:
Mono. Fat
0.63 g
Polyunsaturated fat:
Poly. Fat
1.05 g
Contains
more
Mono. Fat Monounsaturated fat
+1367.6%
Contains
more
Poly. Fat Polyunsaturated fat
+35.3%
Contains
less
Sat. Fat Saturated fat
-92.5%