Chicken gizzards vs. Pheasant — In-Depth Nutrition Comparison
Compare
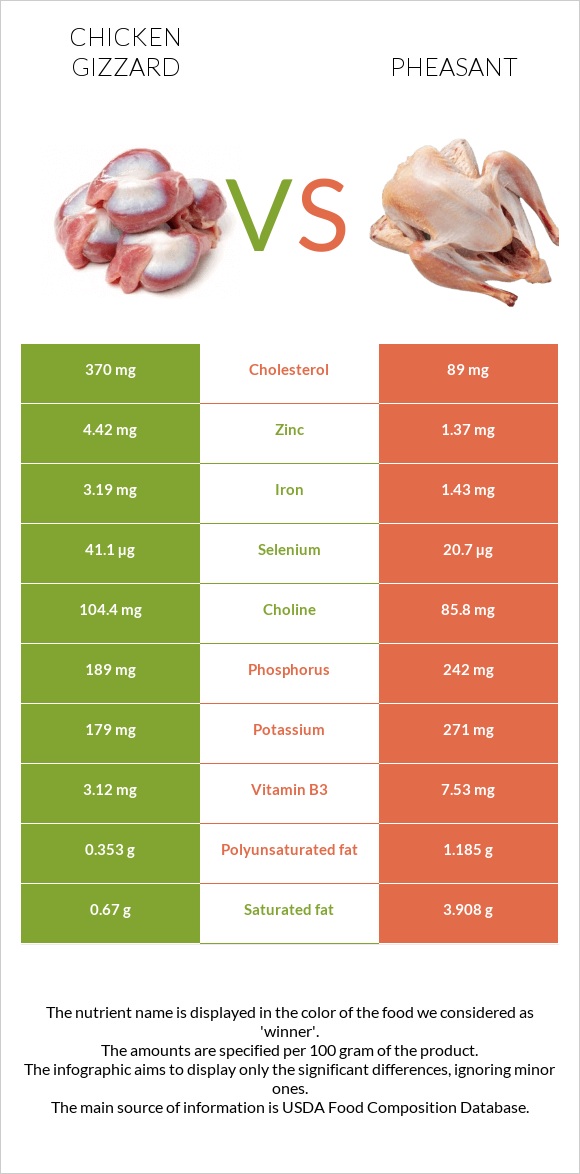
What are the differences between chicken gizzards and pheasant?
- Chicken gizzards are higher in selenium, zinc, iron, vitamin B12, and copper, yet pheasant is higher in vitamin B6, vitamin B3, and phosphorus.
- Chicken gizzards' daily need coverage for cholesterol is 94% more.
- Chicken gizzards have 3 times more zinc than pheasant. While chicken gizzards have 4.42mg of zinc, pheasant has only 1.37mg.
- The amount of cholesterol in pheasant is lower.
We used Chicken, gizzard, all classes, cooked, simmered and Pheasant, cooked, total edible types in this article.
Infographic
Infographic link
Mineral Comparison
Mineral comparison score is based on the number of minerals by which one or the other food is richer. The "coverage" charts below show how much of the daily needs can be covered by 300 grams of the food.
| Contains more IronIron | +123.1% |
| Contains more CopperCopper | +91.7% |
| Contains more ZincZinc | +222.6% |
| Contains more ManganeseManganese | +∞% |
| Contains more SeleniumSelenium | +98.6% |
| Contains more MagnesiumMagnesium | +633.3% |
| Contains more PotassiumPotassium | +51.4% |
| Contains more PhosphorusPhosphorus | +28% |
| Contains less SodiumSodium | -23.2% |
Vitamin Comparison
Vitamin comparison score is based on the number of vitamins by which one or the other food is richer. The "coverage" charts below show how much of the daily needs can be covered by 300 grams of the food.
| Contains more Vitamin B2Vitamin B2 | +16.7% |
| Contains more Vitamin B5Vitamin B5 | +∞% |
| Contains more Vitamin B12Vitamin B12 | +44.4% |
| Contains more Vitamin CVitamin C | +∞% |
| Contains more Vitamin DVitamin D | +∞% |
| Contains more Vitamin AVitamin A | +∞% |
| Contains more Vitamin EVitamin E | +35% |
| Contains more Vitamin B1Vitamin B1 | +169.2% |
| Contains more Vitamin B3Vitamin B3 | +141.3% |
| Contains more Vitamin B6Vitamin B6 | +956.3% |
| Contains more Vitamin KVitamin K | +∞% |
All nutrients comparison - raw data values
| Nutrient |  |
 |
DV% diff. |
| Cholesterol | 370mg | 89mg | 94% |
| Vitamin B6 | 0.071mg | 0.75mg | 52% |
| Selenium | 41.1µg | 20.7µg | 37% |
| Zinc | 4.42mg | 1.37mg | 28% |
| Vitamin B3 | 3.12mg | 7.53mg | 28% |
| Iron | 3.19mg | 1.43mg | 22% |
| Saturated fat | 0.67g | 3.908g | 15% |
| Fats | 2.68g | 12.1g | 14% |
| Vitamin B12 | 1.04µg | 0.72µg | 13% |
| Monounsaturated fat | 0.528g | 5.627g | 13% |
| Copper | 0.161mg | 0.084mg | 9% |
| Vitamin B5 | 0.468mg | 9% | |
| Phosphorus | 189mg | 242mg | 8% |
| Vitamin A | 0µg | 57µg | 6% |
| Polyunsaturated fat | 0.353g | 1.185g | 6% |
| Magnesium | 3mg | 22mg | 5% |
| Calories | 154kcal | 239kcal | 4% |
| Protein | 30.39g | 32.4g | 4% |
| Vitamin B1 | 0.026mg | 0.07mg | 4% |
| Vitamin K | 0µg | 4.9µg | 4% |
| Vitamin C | 0mg | 2.3mg | 3% |
| Potassium | 179mg | 271mg | 3% |
| Manganese | 0.074mg | 3% | |
| Choline | 104.4mg | 85.8mg | 3% |
| Vitamin B2 | 0.21mg | 0.18mg | 2% |
| Vitamin D* | 0 IU | 7 IU | 1% |
| Vitamin D | 0µg | 0.2µg | 1% |
| Sodium | 56mg | 43mg | 1% |
| Protein per 100 calories | 20g | 14g | N/A |
| Calories per 10 g protein | 51kcal | 74kcal | N/A |
| Weight per 100 calories | 65g | 42g | N/A |
| Unsaturated / Saturated Fat ratio | 1.3 | 1.7 | N/A |
| Calcium | 17mg | 16mg | 0% |
| Vitamin E | 0.2mg | 0.27mg | 0% |
| Folate | 5µg | 5µg | 0% |
| Trans fat | 0.13g | N/A | |
| Omega-3 - ALA | 0.004g | N/A | |
| Omega-6 - Gamma-linoleic acid | 0.003g | N/A | |
| Omega-6 - Eicosadienoic acid | 0.019g | N/A |
Macronutrient Comparison
Macronutrient breakdown side-by-side comparison
Protein:
30.39 g
Fats:
2.68 g
Carbs:
0 g
Water:
67.93 g
Other:
0 g
Protein:
32.4 g
Fats:
12.1 g
Carbs:
0 g
Water:
54.2 g
Other:
1.3 g
| Contains more WaterWater | +25.3% |
| Contains more FatsFats | +351.5% |
| Contains more OtherOther | +∞% |
~equal in
Protein
~32.4g
~equal in
Carbs
~0g
Fat Type Comparison
Fat type breakdown side-by-side comparison
Saturated fat:
Sat. Fat
0.67 g
Monounsaturated fat:
Mono. Fat
0.528 g
Polyunsaturated fat:
Poly. Fat
0.353 g
Saturated fat:
Sat. Fat
3.908 g
Monounsaturated fat:
Mono. Fat
5.627 g
Polyunsaturated fat:
Poly. Fat
1.185 g
| Contains less Sat. FatSaturated fat | -82.9% |
| Contains more Mono. FatMonounsaturated fat | +965.7% |
| Contains more Poly. FatPolyunsaturated fat | +235.7% |


