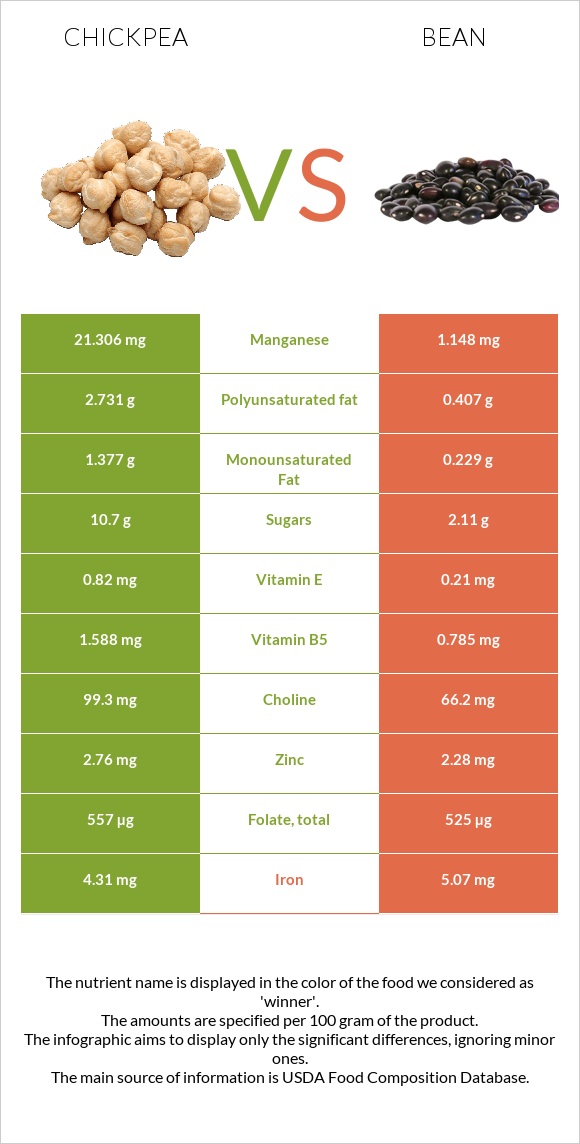
What are the main differences between chickpeas and beans? Chickpeas have more folate, iron, copper, phosphorus, fiber, and polyunsaturated fat than beans. Chickpeas' daily need coverage for folate is 37% higher. Beans have 10 times less iron than chickpeas. Chickpeas have 2.89mg of iron, while beans have 0.29mg. Chickpeas are lower in sugar. We used Chickpeas (garbanzo beans, bengal gram), mature seeds, cooked, boiled, without salt and Beans, baked, canned, no salt added types in this comparison.
Infographic
Mineral Comparison
Mineral comparison score is based on the number of minerals by which one or the other food is richer. The "coverage" charts below show how much of the daily needs can be covered by 300 grams of the food.
5
100 g
300 g
1 cup - 164g
Magnesium
Magnesium
Calcium
Calcium
Potassium
Potassium
Iron
Iron
Copper
Copper
Zinc
Zinc
Phosphorus
Phosphorus
Sodium
Sodium
Manganese
Manganese
Selenium
Selenium
34%
15%
26%
108%
117%
42%
72%
0.91%
134%
20%
2
100 g
300 g
1 cup - 253g
Magnesium
Magnesium
Calcium
Calcium
Potassium
Potassium
Iron
Iron
Copper
Copper
Zinc
Zinc
Phosphorus
Phosphorus
Sodium
Sodium
Manganese
Manganese
Selenium
Selenium
23%
15%
26%
11%
69%
38%
45%
0.13%
0%
25%
Vitamin Comparison
Vitamin comparison score is based on the number of vitamins by which one or the other food is richer. The "coverage" charts below show how much of the daily needs can be covered by 300 grams of the food.
5
100 g
300 g
1 cup - 164g
Vitamin C
Vit. C
Vitamin D
Vit. D
Vitamin A
Vit. A
Vitamin E
Vit. E
Vitamin B1
Vit. B1
Vitamin B2
Vit. B2
Vitamin B3
Vit. B3
Vitamin B5
Vit. B5
Vitamin B6
Vit. B6
Vitamin B12
Vit. B12
Vitamin K
Vit. K
Folate
Folate
4.3%
0%
0.33%
7%
29%
15%
9.9%
17%
32%
0%
10%
129%
3
100 g
300 g
1 cup - 253g
Vitamin C
Vit. C
Vitamin D
Vit. D
Vitamin A
Vit. A
Vitamin E
Vit. E
Vitamin B1
Vit. B1
Vitamin B2
Vit. B2
Vitamin B3
Vit. B3
Vitamin B5
Vit. B5
Vitamin B6
Vit. B6
Vitamin B12
Vit. B12
Vitamin K
Vit. K
Folate
Folate
10%
0%
1.7%
3%
38%
14%
8.1%
0%
30%
0%
2%
18%
All nutrients comparison - raw data values
Nutrient
DV% diff.
Manganese
1.03mg
45%
Folate
172µg
24µg
37%
Iron
2.89mg
0.29mg
33%
Copper
0.352mg
0.206mg
16%
Phosphorus
168mg
104mg
9%
Protein
8.86g
4.8g
8%
Fiber
7.6g
5.5g
8%
Polyunsaturated fat
1.156g
0.172g
7%
Vitamin B5
0.286mg
6%
Magnesium
48mg
32mg
4%
Calories
164kcal
105kcal
3%
Fats
2.59g
0.4g
3%
Vitamin B1
0.116mg
0.15mg
3%
Vitamin K
4µg
0.8µg
3%
Vitamin C
1.3mg
3.1mg
2%
Carbs
27.42g
20.49g
2%
Choline
42.8mg
30.8mg
2%
Zinc
1.53mg
1.4mg
1%
Vitamin E
0.35mg
0.15mg
1%
Selenium
3.7µg
4.5µg
1%
Vitamin B3
0.526mg
0.43mg
1%
Vitamin B6
0.139mg
0.13mg
1%
Saturated fat
0.269g
0.103g
1%
Monounsaturated fat
0.583g
0.035g
1%
Protein per 100 calories
5.4g
4.6g
N/A
Calories per 10 g protein
185kcal
219kcal
N/A
Weight per 100 calories
61g
95g
N/A
Unsaturated / Saturated Fat ratio
6.5
2
N/A
Net carbs
19.82g
14.99g
N/A
Calcium
49mg
50mg
0%
Potassium
291mg
296mg
0%
Sugar
4.8g
7.78g
N/A
Sodium
7mg
1mg
0%
Vitamin A
1µg
5µg
0%
Vitamin B2
0.063mg
0.06mg
0%
Tryptophan
0.085mg
0%
Threonine
0.329mg
0%
Isoleucine
0.38mg
0%
Leucine
0.631mg
0%
Lysine
0.593mg
0%
Methionine
0.116mg
0%
Phenylalanine
0.475mg
0%
Valine
0.372mg
0%
Histidine
0.244mg
0%
Macronutrient Comparison
Macronutrient breakdown side-by-side comparison
3
9%
3%
27%
60%
Protein:
8.86 g
Fats:
2.59 g
Carbs:
27.42 g
Water:
60.21 g
Other:
0.92 g
2
5%
20%
73%
2%
Protein:
4.8 g
Fats:
0.4 g
Carbs:
20.49 g
Water:
72.6 g
Other:
1.71 g
Contains
more
Protein Protein
+84.6%
Contains
more
Fats Fats
+547.5%
Contains
more
Carbs Carbs
+33.8%
Contains
more
Water Water
+20.6%
Contains
more
Other Other
+85.9%
Fat Type Comparison
Fat type breakdown side-by-side comparison
2
13%
29%
58%
Saturated fat:
Sat. Fat
0.269 g
Monounsaturated fat:
Mono. Fat
0.583 g
Polyunsaturated fat:
Poly. Fat
1.156 g
1
33%
11%
55%
Saturated fat:
Sat. Fat
0.103 g
Monounsaturated fat:
Mono. Fat
0.035 g
Polyunsaturated fat:
Poly. Fat
0.172 g
Contains
more
Mono. Fat Monounsaturated fat
+1565.7%
Contains
more
Poly. Fat Polyunsaturated fat
+572.1%
Contains
less
Sat. Fat Saturated fat
-61.7%